
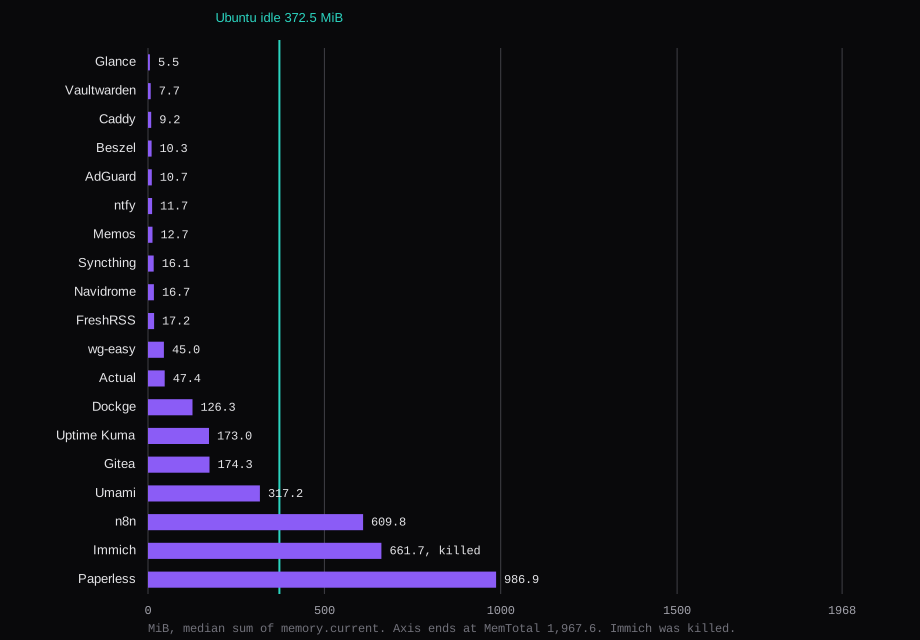
Ubuntu with Docker running and no containers used 372.5 MiB on this guest, which left 1,595.1 MiB available out of a MemTotal of 1,967.6 MiB. I then started 19 compose projects one at a time, removed the volumes between them, left each one alone for 10 minutes, and took 20 readings 30 seconds apart. Eighteen stayed up. Paperless-ngx, with Postgres and Valkey, was the largest that still qualified: 986.9 MiB across the three containers, and 951.8 MiB still available. Immich 3.3.5, machine learning left out of the compose file, was killed. The kernel's line was Out of memory: Killed process 40558 (immich) total-vm:3326668kB, anon-rss:781468kB, file-rss:0kB, shmem-rss:0kB, UID:0 pgtables:16460kB oom_score_adj:0.
A project fits when its median plus that 372.5 MiB stays under MemTotal, MemAvailable stays above 200 MiB, and the restart count stays at zero. Adding each vendor's minimum together is how a 2 GB box gets overfilled, because those minimums already assume they own the machine. The number in each row is the sum of cgroup memory.current for that project's containers. The cgroup charges the container's page cache, so it is the number the kernel is accounting. That is the column in the table.
| App | Image id | Containers | Median MiB | Max | PSS | docker stats | Available | Restarts | OOM |
|---|---|---|---|---|---|---|---|---|---|
| Glance v0.8.7 | bc5a392672c1 | 1 | 5.5 | 5.5 | 16.2 | 5.5 | 1,569.6 | 0 | no |
| Vaultwarden 1.37.4 | efb3cde96201 | 1 | 7.7 | 7.8 | 31.8 | 7.4 | 1,560.8 | 0 | no |
| Caddy 2.11.7 | 36c24ad91a7f | 1 | 9.2 | 9.2 | 44.3 | 9.2 | 1,554.2 | 0 | no |
| Beszel 0.21.1 | 8514a69d9bbb | 1 | 10.3 | 10.3 | 31.5 | 9.8 | 1,558.4 | 0 | no |
| AdGuard Home v0.107.79 | aba9e3bf0613 | 1 | 10.7 | 10.7 | 26.8 | 10.7 | 1,558.3 | 0 | no |
| ntfy v2.36.0 | fb48c413eb11 | 1 | 11.7 | 11.7 | 42.1 | 11.7 | 1,568.8 | 0 | no |
| Memos 26.11.0 | 087e7dc6b76b | 1 | 12.7 | 12.8 | 45.5 | 12.5 | 1,567.2 | 0 | no |
| Syncthing 2.1.7 | 2b71da7c0d0a | 1 | 16.1 | 16.1 | 40.9 | 16.0 | 1,558.0 | 0 | no |
| Navidrome 0.64.2 | 38dc2727bfcf | 1 | 16.7 | 16.8 | 40.1 | 12.1 | 1,553.1 | 0 | no |
| FreshRSS 1.30.4 | af4438522954 | 1 | 17.2 | 17.2 | 38.2 | 17.1 | 1,540.4 | 0 | no |
| wg-easy 15.5.0 | 071f79a639e9 | 1 | 45.0 | 45.3 | 106.0 | 45.0 | 1,461.9 | 0 | no |
| Actual 26.11.0 | 06cf186569cf | 1 | 47.4 | 47.4 | 104.4 | 47.3 | 1,501.4 | 0 | no |
| Dockge 1.5.0 | 335c6368b880 | 1 | 126.3 | 127.3 | 185.6 | 125.8 | 1,413.6 | 0 | no |
| Uptime Kuma 2.5.8 | 20abea8c48a1 | 1 | 173.0 | 173.2 | 152.0 | 172.9 | 1,428.8 | 0 | no |
| Gitea 28.3.0 | 8967bf9deaf3 | 1 | 174.3 | 174.3 | 124.4 | 59.5 | 1,509.0 | 0 | no |
| Umami 3.4.1 | e69d1a7932e9 | 2 | 317.2 | 317.2 | 210.4 | 248.6 | 1,374.6 | 0 | no |
| n8n 2.45.7 | 9a8d8dcea756 | 1 | 609.8 | 611.9 | 422.2 | 464.0 | 1,150.2 | 0 | no |
| Immich v3.3.5 | 485d546a2e31 | 3 | 661.7 | 1,486.8 | 651.2 | 712.2 | 1,132.0 | 38 | yes |
| Paperless-ngx 3.4.1 | 1a08d8dfc2b5 | 3 | 986.9 | 987.0 | 615.4 | 781.6 | 951.8 | 0 | no |
Image id is the first 12 hex characters of the local image id. MiB are medians of 20 rounds, except the Immich row, which is the 16 rounds that still had a reading. Available is MemAvailable. PSS is smem's proportional set size for the container's PIDs.
How much RAM does Ubuntu use on a 2 GB VPS?
The guest was Ubuntu 24.04.5, kernel 6.8.0-147-generic, started with qemu -m 2048 -smp 2. MemTotal came out at 2,014,852 kB, which is 1,967.6 MiB. The hypervisor's 2,048 MB and the guest's MemTotal are different numbers, and the fit math uses the one free prints. Swap was off for every row in the table. Docker was the Ubuntu package, engine 29.1.3, API 1.52, containerd 2.2.1, runc 1.3.4. A single free after that package was installed, and before the 20 rounds, showed 367 MiB used and 1,599 MiB available. The 20-round median, still with zero containers, was 372.5 MiB used and 1,595.1 MiB available.
The list ran on three guests of that same size. The OS line is the 20-round sample from the guest that had Docker up and zero containers. On a project that fits, I still want MemAvailable above 200 MiB, because the cgroup sum and the guest's available memory answer different questions. Paperless makes that concrete. Its three containers sat at 986.9 MiB, and 986.9 plus the 372.5 OS line is 1,359.4, under 1,967.6. During those same rounds the guest's available memory was 951.8 MiB, so used memory on the whole guest was about 1,015.8. Adding the idle OS to the cgroup double-counts cache the kernel can still hand out. The add is the conservative check. MemAvailable is what the guest had left.
How do you measure idle container memory?
One GET, so the process has finished its first page, then 10 minutes with no traffic, then 20 rounds, 30 seconds apart. Each round is docker stats --no-stream, every container's cgroup v2 memory.current, and smem. Volumes were removed between projects. smem was the Ubuntu package, 1.5-2. PSS in the table is the sum of smem's PSS column for the PIDs from docker top, and the units in that column are kilobytes.
docker stats --no-stream
cid=$(docker inspect -f '{{.Id}}' gitea)
cat /sys/fs/cgroup/system.slice/docker-${cid}.scope/memory.current
sudo smem -c 'pid pss command' -s pss
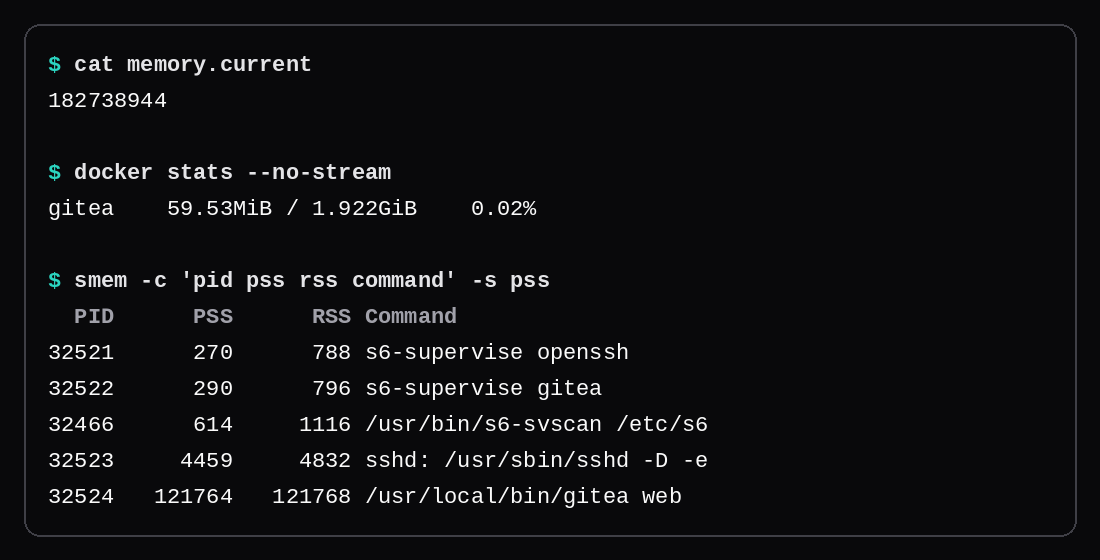
On this guest the cgroup file for Gitea was /sys/fs/cgroup/system.slice/docker-681fd888f7a977cbb51106ffe00d896793a8d8b5532d284dc6283ea7a692e619.scope/memory.current. One of the 20 rounds read 182738944 from that file. That is 174.3 MiB, and it is the same number on every round in the Gitea row.
A few of these were left on the first page they serve. AdGuard Home, FreshRSS, Navidrome, Paperless, Uptime Kuma, and the wg-easy run in the table answered 302. Gitea and Actual answered 200, and I left both on that page. Glance, Beszel, Dockge, Memos, ntfy, and Syncthing answered 200 on a default page. Beszel was the hub on its own. Caddy answered a fixed body. The command was caddy respond --listen :80 --body ok, and that GET returned 200.
Vaultwarden had one account created before the quiet window, and signups were left open for the idle. Closing signups is the point of the Vaultwarden piece. n8n had its owner account created before the quiet window. What a 1 GB guest does once workflows are running is the n8n piece. This row is the idle on 2 GB.
Where docker stats and smem part company
Gitea is the clean split. The cgroup stayed at 174.3 MiB, docker stats printed 59.5, and smem's PSS for the container was 124.4. docker stats on this engine tracked the cgroup for the small single containers, within a few tenths of a MiB, and then fell behind once the process had a real page cache. Umami's stats median was 248.6 against a cgroup of 317.2. n8n was 464.0 against 609.8. Paperless was 781.6 against 986.9. The cgroup is higher because it charges cache the process has read and the kernel is still holding.
PSS goes the other way on the small binaries. ntfy was 11.7 MiB in the cgroup and 42.1 of PSS. Vaultwarden was 7.7 and 31.8. Memos was 12.7 and 45.5. Caddy was 9.2 and 44.3. PSS is the process's share of pages it holds in common with other processes, so a small Go or Rust binary can look several times larger there than it does in the cgroup. On the bigger apps the relationship flips, and PSS comes in under the cgroup: Gitea at 124.4 against 174.3, Uptime Kuma at 152.0 against 173.0. I kept memory.current as the headline because that is the counter the OOM killer is looking at.
The Vaultwarden wiki says "Note: building the Vault needs ~1.5GB of RAM" and, in the next sentence, "This much memory is only needed for building it, running vaultwarden with vault needs only about 10MB of RAM." The idle cgroup was 7.7 MiB and docker stats was 7.4. The "about 10MB" line matches those two. The 31.8 MiB of PSS is the other counter.
Which apps stay up on 2 GB?
Paperless is the tightest row that still qualifies. Three containers, median sum 986.9 MiB, max 987.0, and the three medians add: the web container 818.2, Postgres 155.7, Valkey 13.0. MemAvailable was 951.8. Restarts were zero, and dmesg had no kill. Postgres here is postgres:18 at 3a4264520e12, Valkey is valkey:9-alpine at bf09d58e96d6. The first GET returned 302.
n8n sat at 609.8 MiB, max 611.9, with 1,150.2 MiB available. One container, n8nio/n8n:2.45.7. Umami was two containers and a flat 317.2 MiB on every round: the app 232.9, Postgres 84.3 (postgres:15-alpine at 54e0dd8e8cdd). Its heartbeat returned 200. docker stats on that pair was 248.6, the same cache gap as Gitea, smaller.
From Dockge at 126.3 MiB down through Glance at 5.5, the restart count is zero and available memory stays above 1,400 MiB. Uptime Kuma is the row where the three counters sit together: cgroup 173.0, stats 172.9, PSS 152.0. The install is the Uptime Kuma piece. Gitea, 174.3 against stats of 59.5, is the terminal shot.
wg-easy's first boot exited. The container log said this, and the restart count reached 29 with memory.current missing on all 20 rounds. OOMKilled was false.
modprobe: FATAL: Module ip6_tables not found in directory /lib/modules/6.8.0-147-generic
ip6tables v1.8.13 (legacy): can't initialize ip6tables table `nat': Table does not exist (do you need to insmod?)
The module files were on the guest's disk. They loaded once the host had run modprobe ip6_tables and modprobe ip6table_nat. After that, the same image stayed up for a full quiet window and a full 20 rounds. That second run is the row in the table: 45.0 MiB, max 45.3, PSS 106.0, stats 45.0, available 1,461.9. The status line moved from "Up 10 minutes" to "Up 20 minutes" across the samples, so the uptime climbed straight through the window. The first exit was a missing kernel module. The table uses the second run.
Immich is the row that fails. Machine learning was left out of the compose file. The server image is ghcr.io/immich-app/immich-server:v3.3.5 at 485d546a2e31, the same id as the Immich piece, which measured 4 GB and 8 GB guests with an upload. This run is idle, on 2 GB. Sixteen of the 20 rounds still had a memory.current for every container. The median of those 16 is 661.7 MiB, the minimum 338.9, the maximum 1,486.8. On those complete rounds the server's own median was 320.2, Postgres 207.7, Valkey 15.5. Those three medians add to 543.4. The median of the sums is 661.7. Medians do not add. PSS was 651.2 on the 10 complete rounds where every container PID was still in smem. docker stats on the 16 complete rounds was 712.2. The two commands are taken seconds apart, and during a restart that is enough for them to disagree.
MemAvailable across all 20 rounds, including the broken ones, had a median of 1,132.0 MiB. The server's restart count at the end of the window was 38. docker inspect reported OOMKilled false, because the container had come back and was running when inspect ran. dmesg is the record. By the first sample the kernel had already killed the process. The warmup GET returned 200 between deaths. The requirements page says "RAM: Minimum 6GB, recommended 8GB" and "For a smooth experience, especially during asset upload, Immich requires at least 6GB of RAM. For systems with only 4GB of RAM, Immich can be run with machine learning features disabled." This guest had 2 GB, machine learning was off, the library was empty, and the process was killed anyway.
I retried once with a 1 GB swapfile. SwapTotal was 1,024 MiB. Across the 15 readings taken while that swapfile was on, SwapFree stayed equal to SwapTotal, so swap used stayed at 0. Four of those 15 readings still had every container's memory.current. Their median sum was 615.1 MiB and the max was 1,547.8. The kills kept arriving. One of them was Out of memory: Killed process 68378 (immich) total-vm:3322984kB, anon-rss:769404kB, file-rss:0kB, shmem-rss:0kB, UID:0 pgtables:16332kB oom_score_adj:0. A project that only stays up by leaning on swap stays out of the fits count. The retry stayed out with it.
Do five small apps fit on one 2 GB VPS?
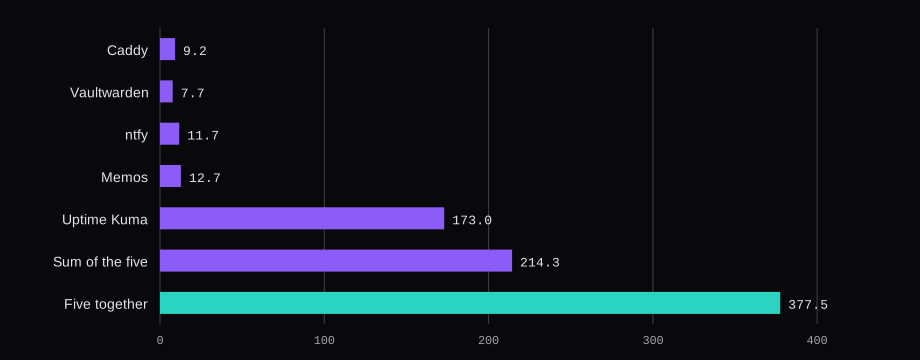
Caddy, Vaultwarden, ntfy, Memos, and Uptime Kuma each stayed up alone, so all five went into one compose file. Alone, their cgroup medians add to 214.3 MiB: 9.2, 7.7, 11.7, 12.7, and 173.0. Together, the cgroup median was 377.5, the max 377.8, docker stats 375.8, and MemAvailable 1,344.4. Every container's restart count was zero. Alone, the five PSS medians add to 315.7. Together, PSS was 314.6. Process memory added up. The cgroup went from 214.3 to 377.5.
In the shared stack the four small containers each sat near 50 MiB: Caddy 50.3, Vaultwarden 50.2, ntfy 50.2, Memos 53.7, and Uptime Kuma 173.2, almost unchanged from its 173.0 alone. The same Caddy image, on a guest of the same size, had been 9.2 MiB a short while earlier and was 50.3 once it shared the daemon with the other four. The containers were gone before I read memory.stat. What I have is the five solo medians, the arithmetic sum, and the five running together.
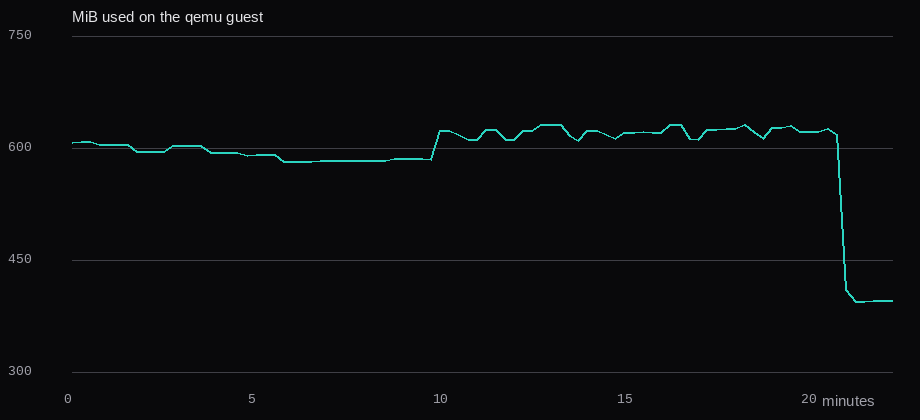
The guest's own memory across that window, MemTotal minus MemAvailable, sat near 590 MiB and then near 620 MiB through the quiet period and the 20 samples. It dropped to about 396 MiB once the containers were removed. That series is the qemu guest. It stays out of the table, and it is separate from any RAM graph in the panel.
Five together at 377.5, plus the 372.5 OS line, is 750.0, and available memory stayed at 1,344.4 MiB. They fit as a group on this idle. Adding five memory.current readings from five separate boots undercounts the cgroup once those containers share a daemon.
What about Home Assistant and Jellyfin?
Both names come up the moment someone asks what fits on a small VPS, and both stayed off this list. The Home Assistant Linux install says "Memory: 2 GB of RAM" and, for the image, "Base Memory: Set to at least 2048 MB, which is 2 GB." That base is the whole guest, before Ubuntu has taken 372.5 MiB. The Jellyfin hardware page says "RAM: 8GB. (4GB may be sufficient for a Linux server without its own GUI.)" and "As a general recommendation, at least 8GB is recommended for the average deployment. For a Linux server running without a GUI, 4GB may be enough." Four gigabytes is already twice this guest. Their own pages already ask for the machine I was measuring, or for a bigger one.
Nextcloud's admin manual is a different kind of number. The system requirements say "Nextcloud needs a minimum of 128MB RAM per process, and we recommend a minimum of 512MB RAM per process." That is a per-PHP-process floor. The Nextcloud piece is that install, on a VPS, with the PHP tuning. The all-in-one image did come up on this guest. Apache, Nextcloud, PostgreSQL, Redis, notify-push, EuroOffice, Talk, Imaginary, and Whiteboard were running, the log said Nextcloud was successfully installed, and one docker stats pass showed EuroOffice at 552 MiB with 485 MiB still available on the guest. Nextcloud and Talk were still unhealthy, dmesg had no kill, and that reading never became a 20-round idle, so it stays out of the table.
Where does a 2 GB VPS plan show up?
On the marketplace, public search starts at noderings.com and a signed-in launch goes to /platform/virtual-machines/create. The docs describe usage-based plans as "Metered consumption (hourly), often with a monthly cap." The card I opened showed the hourly rate. Nothing on it named a monthly cap, and the hourly price stays hourly. The usage-based Enzonix list in Ashburn had three plans: 1 vCPU, 1 GB RAM, 20 GB disk at $0.007/hr; 1 vCPU, 2 GB RAM, 40 GB disk at $0.01/hr; 2 vCPU, 4 GB RAM, 80 GB disk at $0.015/hr. The provider line said "No reviews yet."
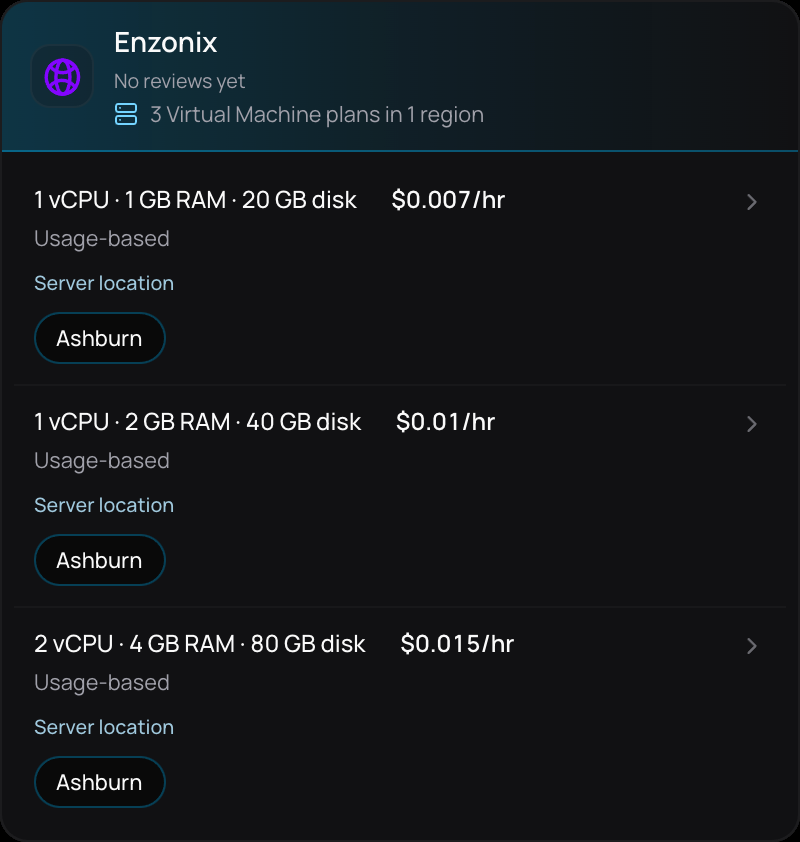
The fixed-price lists I opened on the same provider, Ashburn and Amsterdam, jump from 1 vCPU, 1 GB RAM, 20 GB disk at $5.00 a month to 2 vCPU, 4 GB RAM, 80 GB disk at $9.00 a month. The next fixed plan up from 1 GB was 4 GB. Virtualized Phoenix's cheapest plan was 2 vCPU, 4 GB RAM, 40 GB disk at $12.49 a month. The 2 GB line in the catalog I clicked through is the usage-based one in the screenshot.
Buy that plan and boot plain Ubuntu. Instant Apps are a separate catalog. The virtual machine docs say "To launch a curated application (for example WordPress) instead of a plain OS, use the Instant Apps tab on create and reinstall." These apps were installed from compose files on plain Ubuntu. The panel's RAM graph, once you have a VM, is the whole guest. A swapfile leaves a killed process in the killed column. What NodeRings is is the longer version of the catalog. The memory numbers are the guest I measured.
FAQ
Does docker stats match memory.current?
On Glance, Caddy, ntfy, AdGuard Home, and Uptime Kuma, the two medians agree to a tenth of a MiB. On Gitea, docker stats printed 59.5 MiB and the cgroup was 174.3. The table uses the cgroup. smem's PSS is a third number, and on Vaultwarden it was 31.8 MiB against a cgroup of 7.7.
Does a swapfile count as room on a 2 GB VPS?
Swap was off for every row in the table. Immich's retry added a 1 GB swapfile. SwapFree stayed equal to SwapTotal, and the kernel kept killing the immich process. A project that only stays up by using swap stays out of the fits count. The retry stayed out with it.
Will Caddy, Vaultwarden, ntfy, Memos, and Uptime Kuma fit together?
Together they used 377.5 MiB of cgroup, against 214.3 if you add the five solo medians. PSS added, 314.6 against 315.7. MemAvailable stayed at 1,344.4 MiB, and all five stayed at a restart count of zero. They fit on this idle. The number to budget is the shared cgroup, 377.5 MiB.
Do Home Assistant and Jellyfin fit in this list?
They were left off. Home Assistant's Linux install asks for 2 GB as the base memory, which is the whole guest. Jellyfin's hardware page says 8 GB, and 4 GB for a Linux server without a GUI. Either figure is the machine I was measuring, or a larger one, before Ubuntu's 372.5 MiB.
Where is the 2 GB plan?
Usage-based Enzonix, Ashburn: 1 vCPU, 2 GB RAM, 40 GB disk, $0.01/hr. The fixed-price rows I opened on Enzonix go from 1 GB at $5.00 a month to 4 GB at $9.00, and Virtualized Phoenix starts at 4 GB for $12.49 a month. Plain Ubuntu is the image that matches this measurement. Instant Apps are a different catalog.