
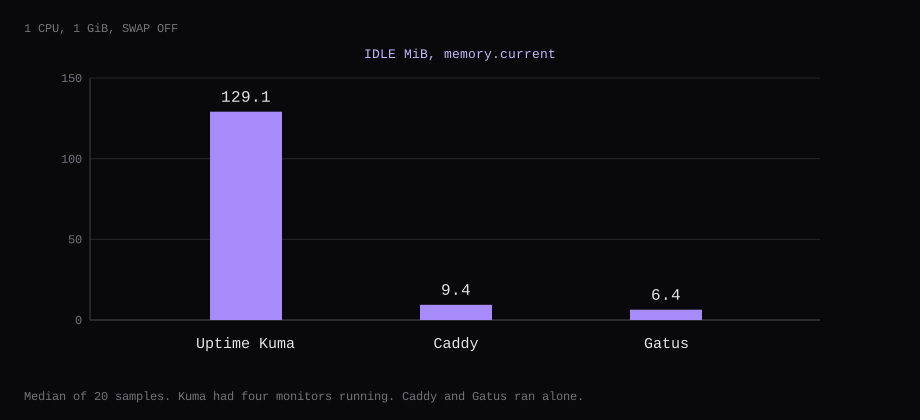
Uptime Kuma 2.5.8 answered 3 seconds after docker compose up, on a 1 GiB cap with one CPU and no swap. The keyword monitor was green at 1 minute 55 seconds. ntfy had the test message at 4 minutes 36 seconds. The status page, incident included, was up at 9 minutes 14 seconds. Idle, the Kuma container held 129.1 MiB. Caddy 2.11.7, measured alone on the same cap, held 9.4 MiB. Gatus 5.38.0 held 6.4 MiB.
A green HTTP 200 misses a full disk and a backup timer that stopped calling. The four checks that earn the RAM are a keyword, certificate expiry, a push URL the backup job has to hit, and the container in front. Keep 3001 on 127.0.0.1. Put Caddy on 443. Send the alert to ntfy and to one more place. If mail is what died, an SMTP-only alert has nowhere to go.
| Check | Type in 2.5.8 | What this run saw |
|---|---|---|
Keyword backup-ok | HTTP(s) - Keyword, every 20 seconds | 200 - OK, keyword is found |
| example.com certificate | HTTP(s), certificate expiry notification on | Cert Exp. 55 days, outside the 21-day warning |
| Backup heartbeat | Push, 120 second window | {"ok":true}, then down 121 seconds later |
| Caddy container | Docker Container, socket /var/run/docker.sock | Up, because the container was running. No healthcheck |
The 15 minutes
The copy of louislam/uptime-kuma:2.5.8 finished in 16 seconds. That image is the linux/amd64 manifest sha256:a3d1aa0de332e1fb316c012529936d23ed235895715bd035af9a4e428f5a001a. docker compose up was 10:18:39 UTC. The process returned HTTP 302 at 10:18:42. The keyword row went green at 10:20:34. The ntfy test message is timestamped 10:23:15. The incident on the status page is timestamped 10:27:53. From the start of the copy to that incident is 11 minutes 12 seconds. The container answered in 3 seconds. The rest was the forms. Uptime Kuma had 93,119 GitHub stars.
The first screen asks which database. Embedded MariaDB, MariaDB/MySQL, or SQLite. The SQLite line on that screen says it is a simple database file, recommended for small-scale deployments, and that before v2.0.0 SQLite was the default. This install used SQLite. The "setting up the database" line cleared in a few seconds. Embedded MariaDB was not measured.
The account is created on that next screen. There is no default password. Settings, Security, 2FA Settings asks for that password and a token from an authenticator. The toast after the confirm was 2FA Enabled. Opening the dialog again showed Active, and a button to disable it. That screen did not print recovery codes.
Four monitors worth adding
The monitor list in 2.5.8 has HTTP(s) - Keyword, Push, and Docker Container. It does not have a separate Certificate Expiry type. Certificate expiry is a checkbox on the HTTP(s) monitor, "Certificate Expiry Notification". The day list lives under Settings, Notifications, and this install still had the defaults: 7, 14, and 21 days. Domain name expiry was turned off on the keyword check, because that URL is a name inside the docker network and a whois lookup would be noise.
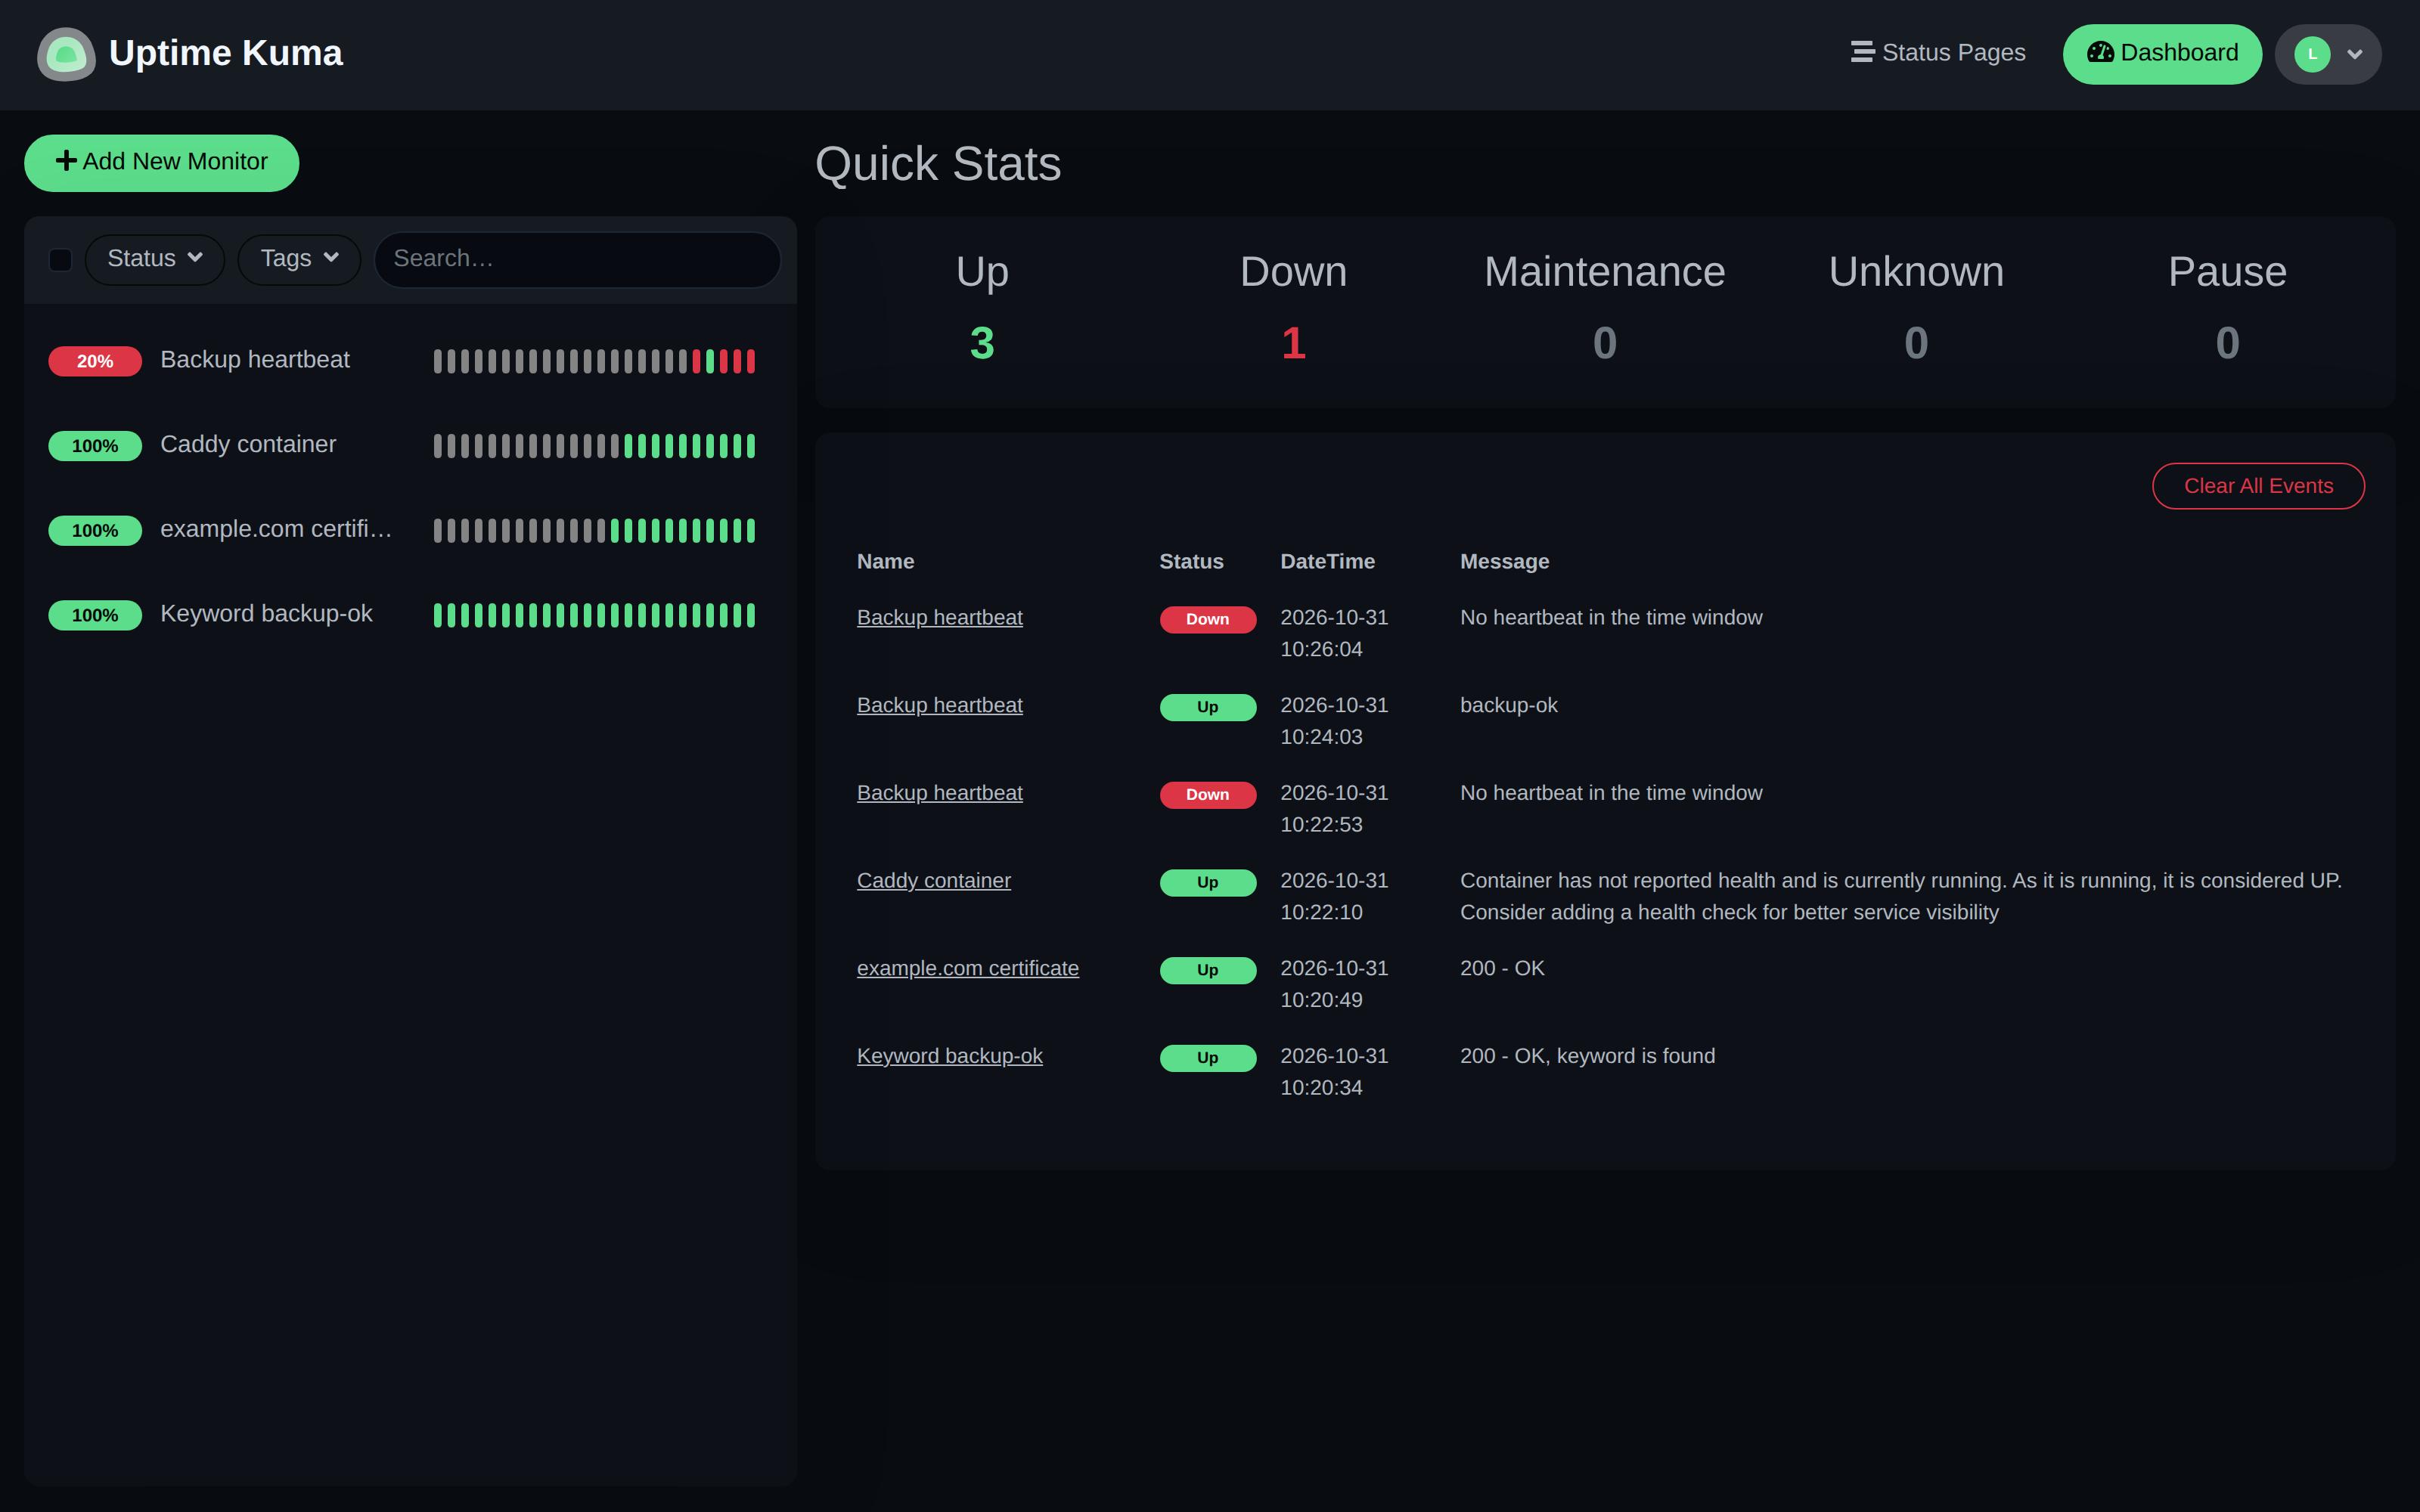
The keyword URL was http://caddy:8088/health.txt, a file Caddy serves on the docker network, body backup-ok. The interval was 20 seconds. The form's default is 60. The first check came back 200 - OK, keyword is found.
example.com is the certificate check: HTTPS, the expiry checkbox on, interval 60 seconds. The status page printed Cert Exp.: 55 days. Fifty-five days is outside the 21-day warning, so the row stays green. The checkbox is what will fire when a certificate gets inside that window.
The push monitor's window was 120 seconds. Kuma prints a URL on the monitor:
curl -fsS \
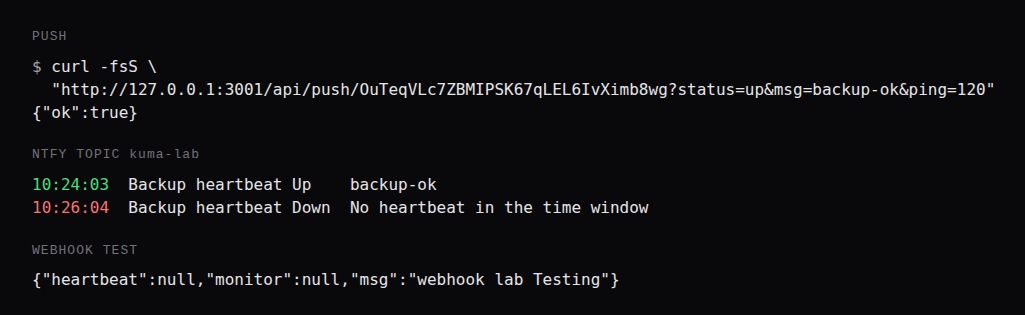
  "http://127.0.0.1:3001/api/push/OuTeqVLc7ZBMIPSK67qLEL6IvXimb8wg?status=up&msg=backup-ok&ping=120"
The body was {"ok":true} at 10:24:03. Nothing called the URL again. At 10:26:04 the row went down with No heartbeat in the time window, 121 seconds after the curl. The backup job curls this URL when it finishes, and curls a failure status when it does not. A timer that never runs never calls, and the row goes red on its own.
The container monitor needed a docker host first. Settings, Docker Hosts, connection type Socket, path /var/run/docker.sock. The test button answered Connected Successfully. Amount of containers: 6. The host name was caddy. The first check said the container has not reported health and is currently running, so it is considered up, and that a healthcheck would be a better signal. A running container with a wedged process still looks up. The keyword check is what sees the wedged process, if the page it serves loses the word.
Release 2.5.8 dropped TLS on the TCP Port monitor. The note says it never worked as expected, and existing monitors become plain TCP. This install did not add a TCP check. Use an HTTP check where you need TLS, or a plain TCP check where you only care that the port accepts a connection.
ntfy, and a second notifier
Both notifiers were applied to the existing monitors. ntfy 2.35.0 ran on the same compose network, published only on 127.0.0.1:8090. The Kuma form took the topic kuma-lab, the server URL http://ntfy, priority 5, and no authentication. The test button returned Sent Successfully. The topic then had three messages:
10:23:15  kuma-lab [Uptime-Kuma]           ntfy lab Testing
10:24:03  Backup heartbeat Up              backup-ok
10:26:04  Backup heartbeat Down            No heartbeat in the time window
The second notifier was a webhook, POST, body preset application/json. The test body that arrived was {"heartbeat":null,"monitor":null,"msg":"webhook lab Testing"}. A webhook to a host you control is enough to prove the second path. Discord, Telegram, or a second ntfy topic on a different machine all fit the same slot. Email (SMTP) is in the same notification list. Leave it as a spare. If the mail server is the outage, the message that would have told you is sitting in the outage.
ntfy on this guest stops when the guest stops, and so does Kuma. The four monitors watch other things. They do not watch the guest. A second machine has to do that, or a dead guest stays quiet.
The status page
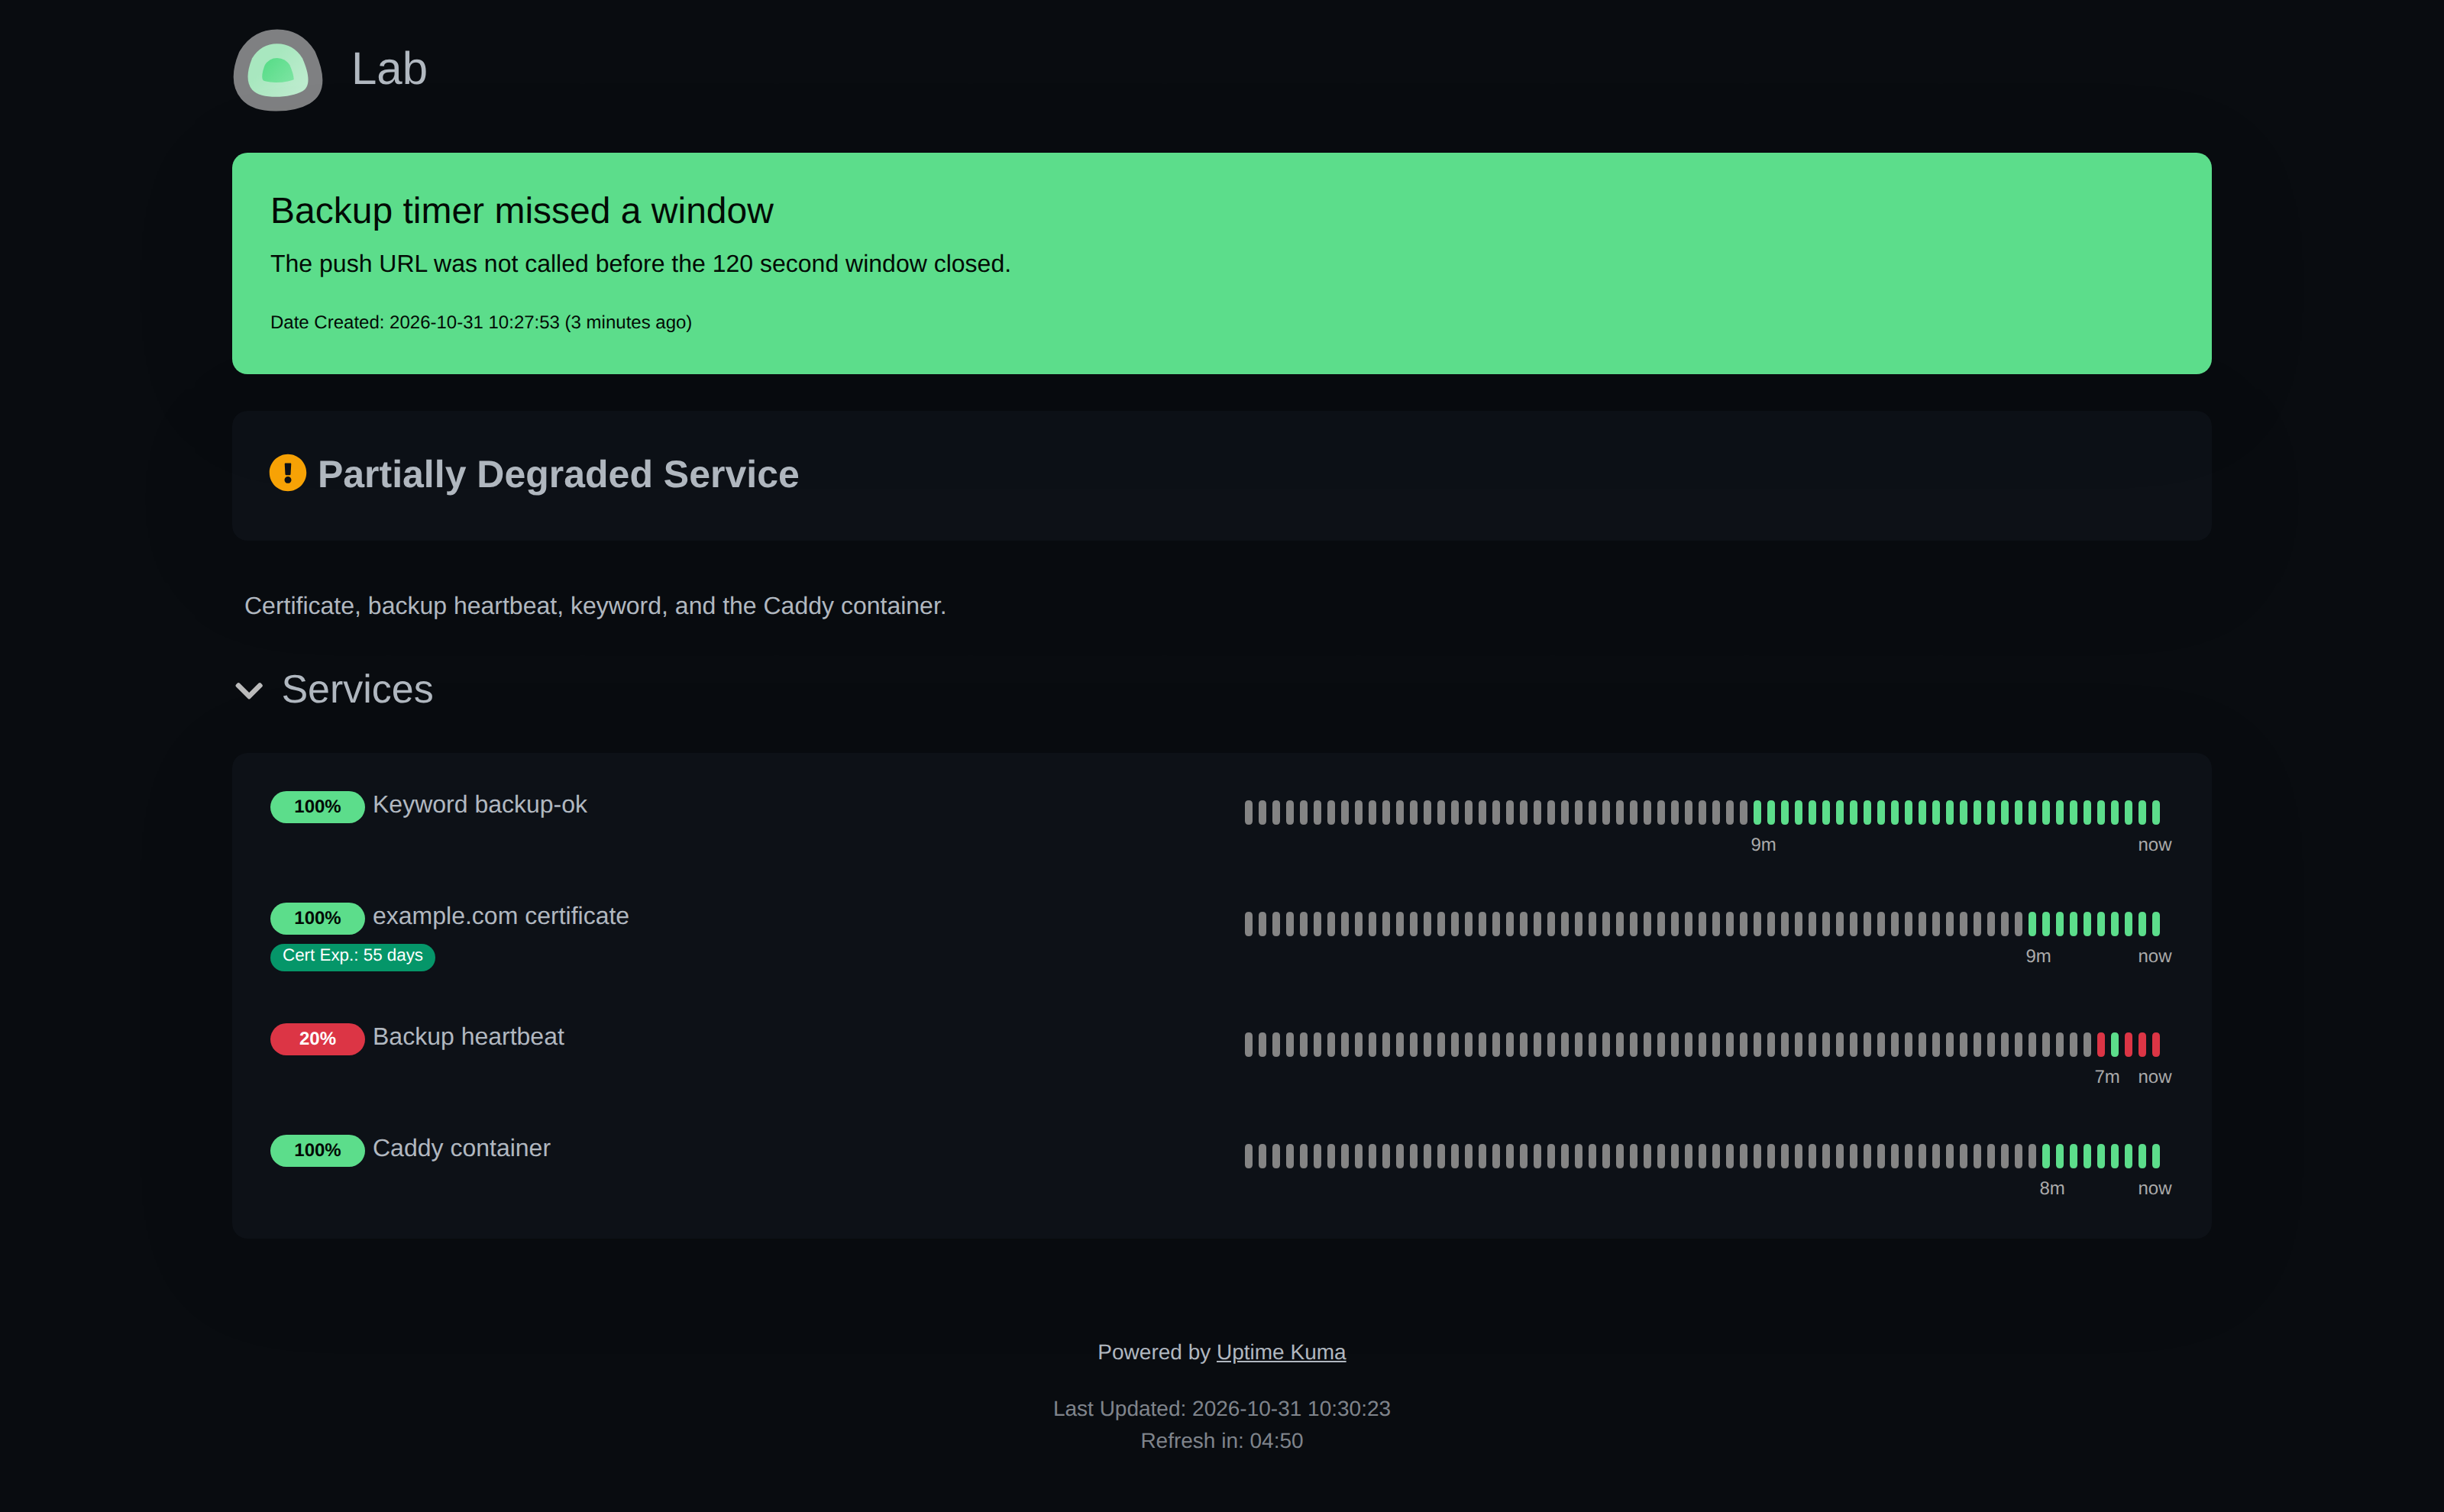
The status page slug is lab, theme dark, "Show Certificate Expiry" on. The domain name on it is status.bench.test, so a request with that host is the public page and the admin stays on port 3001. Caddy proxies it:
status.bench.test:80 {
	reverse_proxy uptime-kuma:3001
}

status.bench.test {
	tls internal
	reverse_proxy uptime-kuma:3001
}
reverse_proxy already upgrades websockets (upstream Caddy notes). The page was loaded through Caddy at status.bench.test, and the heartbeat bars rendered. On this machine Caddy's 80 and 443 were published as 127.0.0.1:8080 and 127.0.0.1:8443, so they would leave the host's own ports alone. On the VPS those two lines are 80:80 and 443:443, and 3001 stays on localhost. Create the admin account over SSH or a tunnel before Caddy publishes the hostname: the first visitor to an unset instance becomes admin (Chris Lorenzo, VPSNine). In Settings, set Trust Proxy to Yes and Primary Base URL to the HTTPS origin so notification links and client IPs are correct. Status pages are public at /status/<slug>; keep internal hostnames and IPs out of monitor display names.
The incident title was "Backup timer missed a window", posted at 10:27:53. The page's own summary, while the push row was down, was Partially Degraded Service. The certificate chip on example.com read 55 days.
The name status.bench.test has to be a real record on a VPS, pointing at the guest. That is the DNS page.
Idle RAM on a 1 GB cap
The cap was a systemd slice, MemoryMax=1G, MemorySwapMax=0, CPUQuota=100%, and each container pinned to one CPU. This machine is a KVM guest with more RAM than that. The slice is the limit, the same way the proxy comparison used a 2 GiB slice. The table is container memory. Ubuntu's own RAM is still on top of it.
Warm-up was one login, then ten minutes with no requests to the UI, 10:32:51 to 10:42:51 UTC. The four monitors kept their intervals, so Kuma was still doing its own checks. Caddy and Gatus each had one request, then the same quiet, each in its own 1 GiB slice on its own CPU. Twenty samples followed, from 10:42:57 to 10:54:16. The loop slept 30 seconds and then spent about 6 seconds reading the counters, so the stamps are about 36 seconds apart. The median is memory.current.
| Uptime Kuma 2.5.8 | Caddy 2.11.7 | Gatus 5.38.0 | |
|---|---|---|---|
| Median memory.current | 129.1 MiB | 9.4 MiB | 6.4 MiB |
| smem PSS, median | 177.4 MiB | 27.1 MiB | 27.9 MiB |
| What was running | Four monitors, SQLite, docker socket | One respond site | One endpoint, interval 1 hour |
Kuma's twenty cgroup samples ran from 133,672,960 bytes to 135,950,336 bytes, 127.5 MiB to 129.7 MiB. The median is 135,342,080 bytes, 129.1 MiB. docker stats over that window read 125.8 MiB and then 128 MiB. Caddy's twenty samples were identical, 9,842,688 bytes, 9.4 MiB, and docker stats said 9.359 MiB. Gatus was identical too, 6,729,728 bytes, 6.4 MiB, and docker stats said 6.418 MiB. Use the cgroup number for sizing. PSS counts shared pages a different way, which is why Caddy's PSS is 27.1 MiB beside a 9.4 MiB cgroup counter. Gatus is the config-file alternative to the Kuma UI. Beszel is the other small status app in this lane. It did not run here.
A 1 GB guest still has to hold the OS. 129.1 MiB is the Kuma container after login, with the checks running. Subtract it from what the guest has left.
The docker socket, and port 3001
The socket was mounted read-only. The test still listed 6 containers, which means the mount is the host daemon, not a view of this compose file. Read-only does not turn that API off. That is why the container check and the admin UI stay off the public interface.
2.5.8's release notes include GHSA-v2p3-6f5h-6hhf and call it an admin-only remote code execution. The detail was not public. Keep the admin on 127.0.0.1:3001:3001, Caddy on 443, and mount the socket only for the container monitor. Drop the socket line if you skip that check.
The listeners during the install:
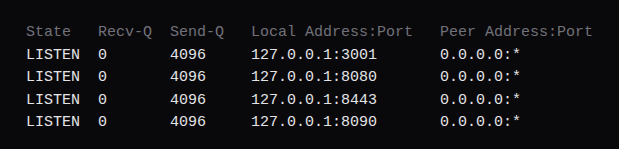
On the VPS, 80 and 443 are the public ones. 3001 and the ntfy port stay on localhost. The firewall in front of the guest should allow 22 and 443, and leave 3001 closed. Those rules live in the panel described in How NodeRings works.
The account, the monitors, and the status page are the SQLite files under /app/data. Copy that directory while you still have the admin password. This version's 2FA screen did not print recovery codes. If yours does, keep them with the copy, off the guest.
FAQ
Does Uptime Kuma 2.5.8 have a certificate expiry monitor?
The dropdown has no Certificate Expiry type. HTTP(s) has a checkbox, Certificate Expiry Notification, and Settings lists the days. This install warned at 7, 14, and 21 days. example.com had 55 days left, so the row stayed up and the status page showed the count.
Should port 3001 be on the public address?
No. Bind it to 127.0.0.1 and publish the status page through Caddy. 2.5.8 fixed an admin-only remote code execution, and the docker socket, if you mount it, is the host daemon.
What if email is the only notification?
If the mail server is the thing that failed, the alert dies with it. ntfy plus a second path, a webhook or a chat app, still fires. ntfy on the same VPS does not help when the VPS itself is down. That check has to live somewhere else.
Does the Docker container check prove the site works?
It proves the container is running. With no healthcheck, Kuma said so in the event: running, therefore up. The keyword monitor is the one that reads the page.
What happened to TLS on TCP monitors?
2.5.8 removed it. The release note says it never worked as expected, and existing TCP monitors become plain TCP. Use HTTP(s) when the certificate matters.