
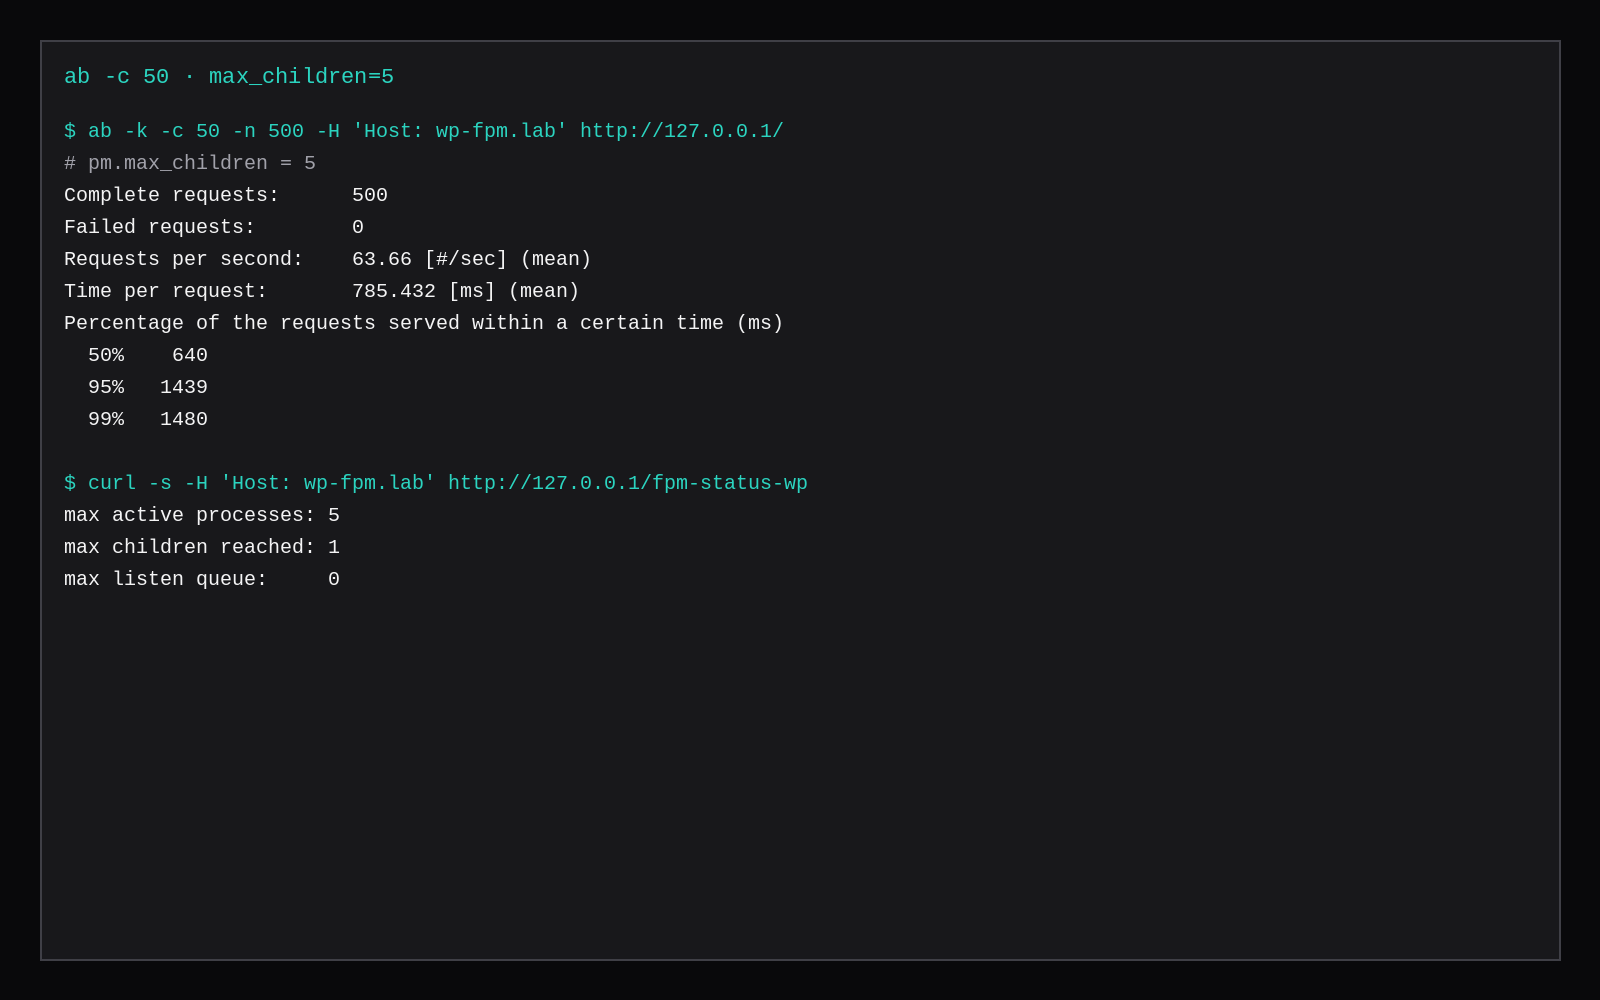
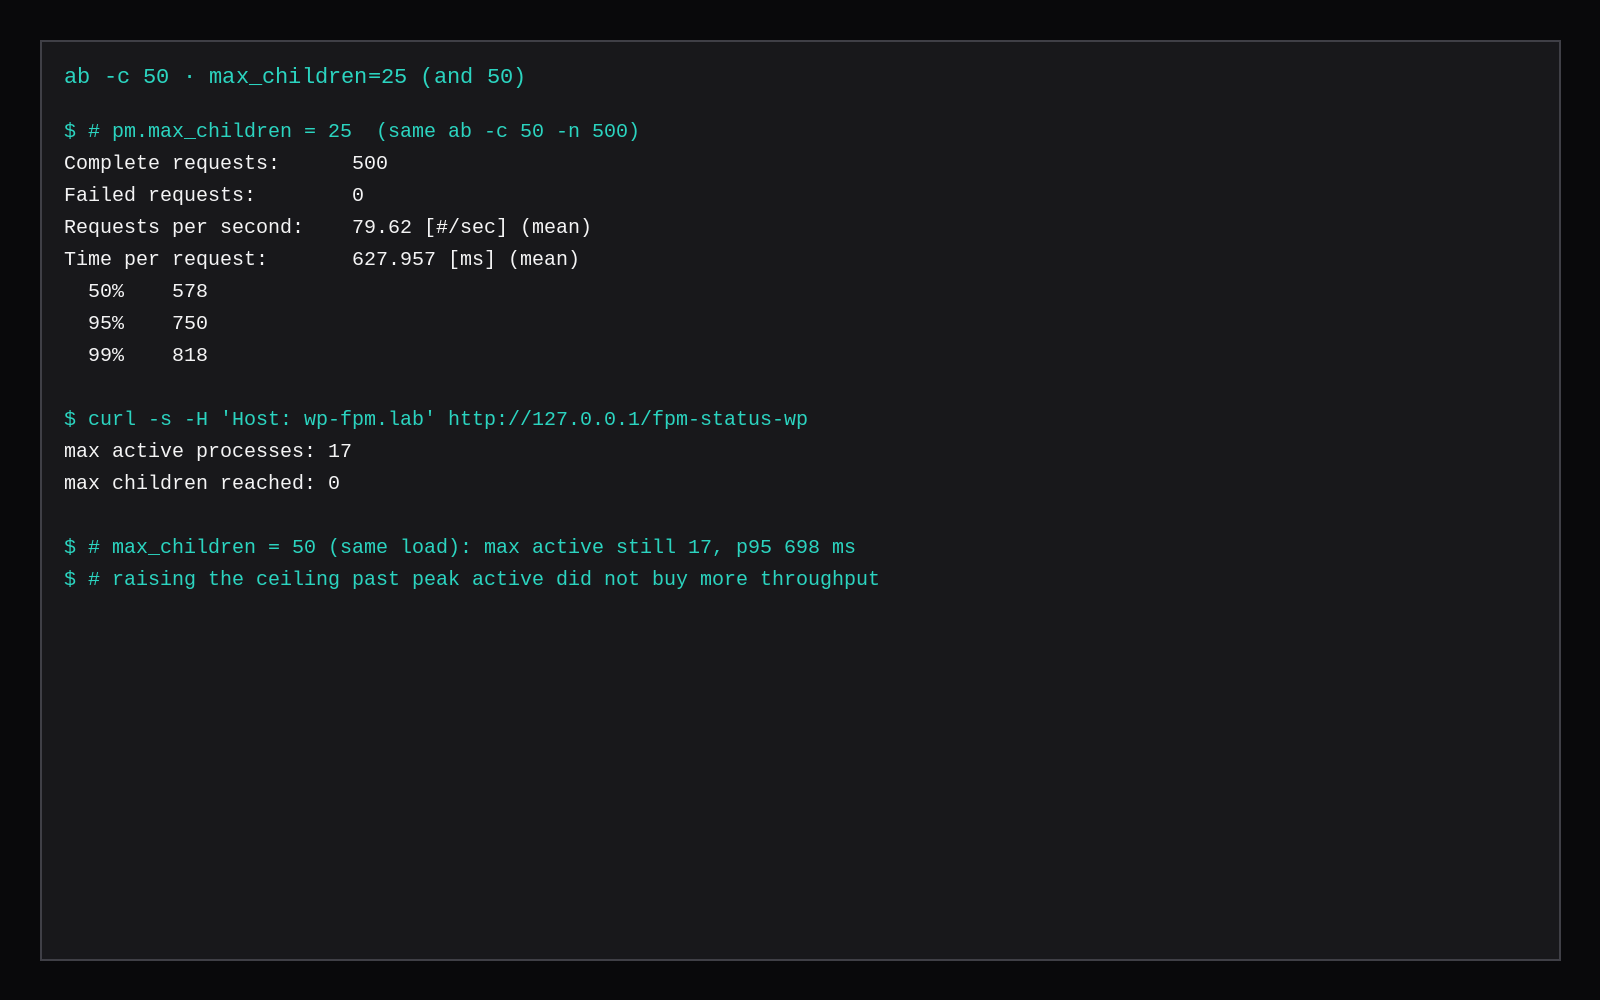
Fifty concurrent clients hit an uncached WordPress 7.1.4 homepage through Nginx and PHP 8.3.6-FPM (ab -k -c 50 -n 500). With pm.max_children = 5, p95 latency was 1439 ms, RPS was 63.66, and php-fpm status showed max active processes: 5 and max children reached: 1. With pm.max_children = 25, p95 fell to 750 ms and RPS rose to 79.62; peak active processes were 17 and children were never exhausted. Raising the ceiling to 50 left peak active at 17 and p95 at 698 ms. Median worker RSS under that load was about 47.2 MiB (48332 KiB).
“50 concurrent users” here means 50 simultaneous HTTP clients on a PHP-rendered URL with no page cache. Cached HTML from LSCache or Nginx fastcgi_cache needs almost no FPM children. Logged-in traffic, /wp-login.php, and cache misses still do.
pm.max_children | p50 (ms) | p95 (ms) | RPS | Peak active | Children reached |
|---|---|---|---|---|---|
| 5 | 640 | 1439 | 63.66 | 5 | yes (1) |
| 25 | 578 | 750 | 79.62 | 17 | no |
| 50 | 601 | 698 | 79.00 | 17 | no |
Failed requests: 0 in all three runs. No 502s in the Nginx error log.
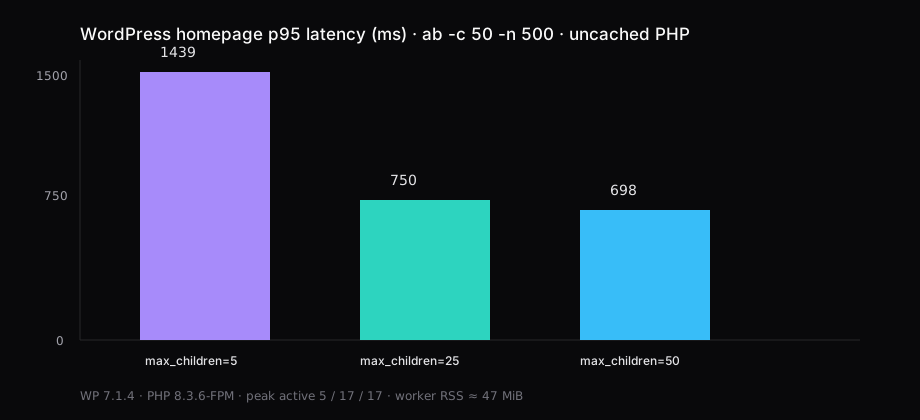
Size from measured worker RSS
The useful formula is boring and local:
pm.max_children ≈ floor( MiB left for PHP / median worker RSS MiB )On this lab, workers sat near 47 MiB while serving WordPress. If a 2 GB VPS leaves about 800 MiB for PHP after the OS and MariaDB (idle memory on 2 GB), that is roughly 800 / 47.2 ≈ 16 children. Peak active under the 50-client run was 17. A pool of 5 matches the stock shape from the Nginx WordPress post and queues hard. A pool of 25 covers the measured peak with spare. A pool of 50 wastes RAM on processes this homepage never needed.
Measure RSS yourself under load:
ps -eo rss,cmd | awk '/pool wp-fpm$/ {print $1}'
# median of many samples while ab or real traffic runs
Do not divide by memory_limit (128M here). That is a ceiling, not the working set.
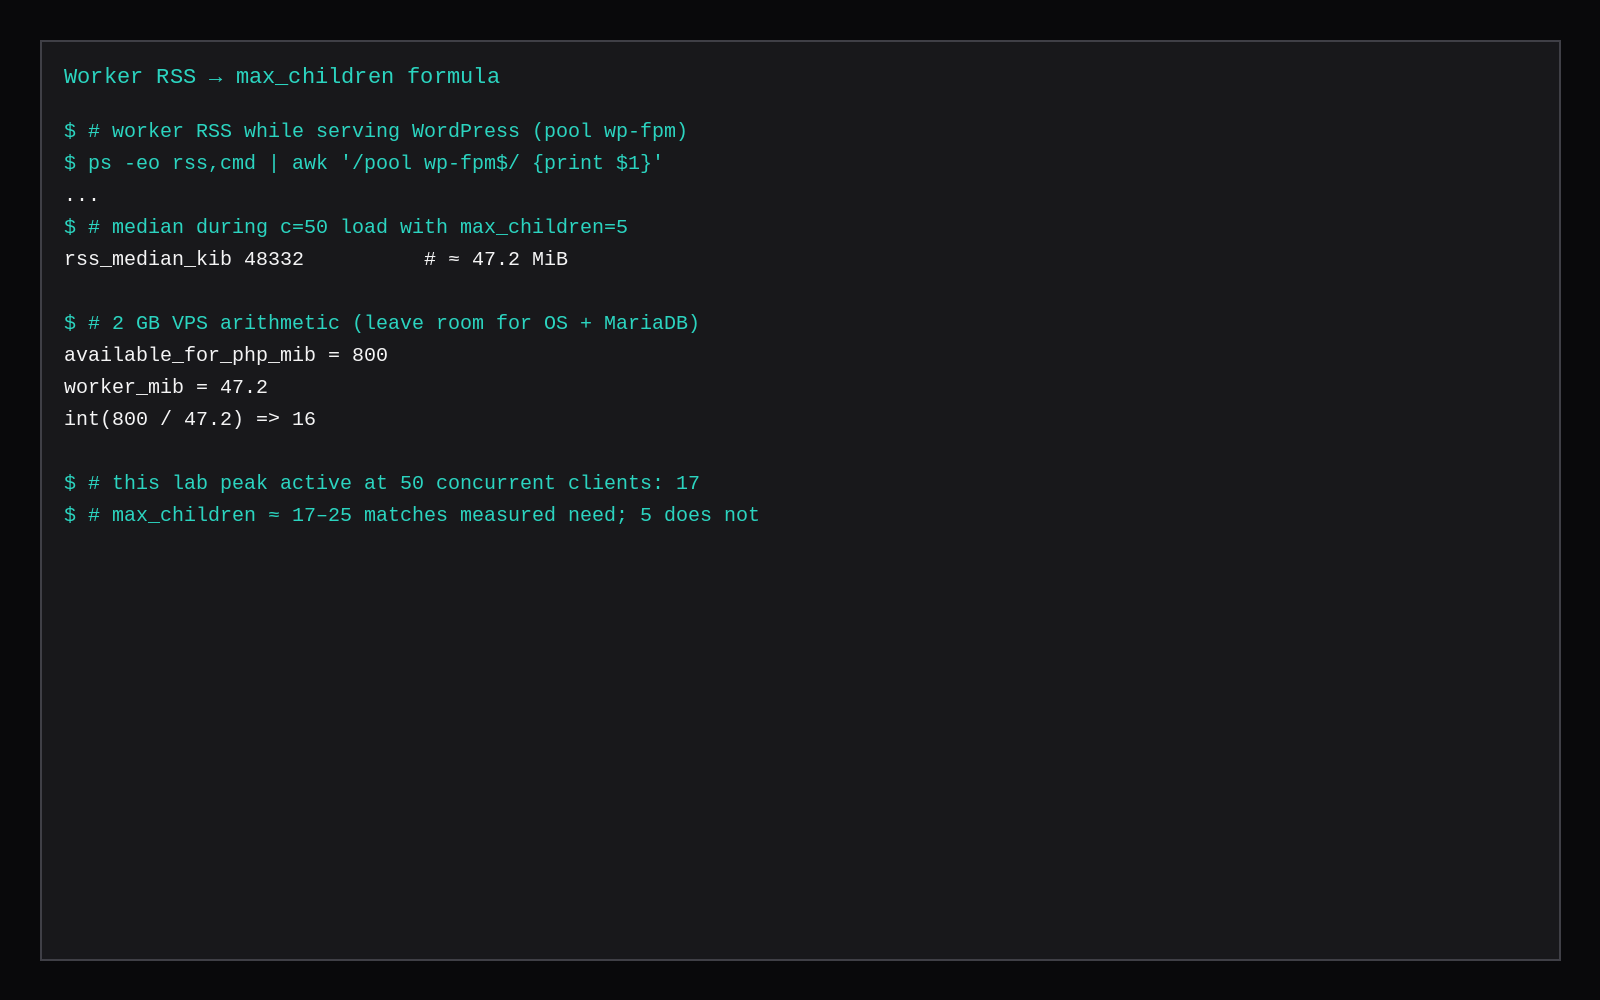
Pool config
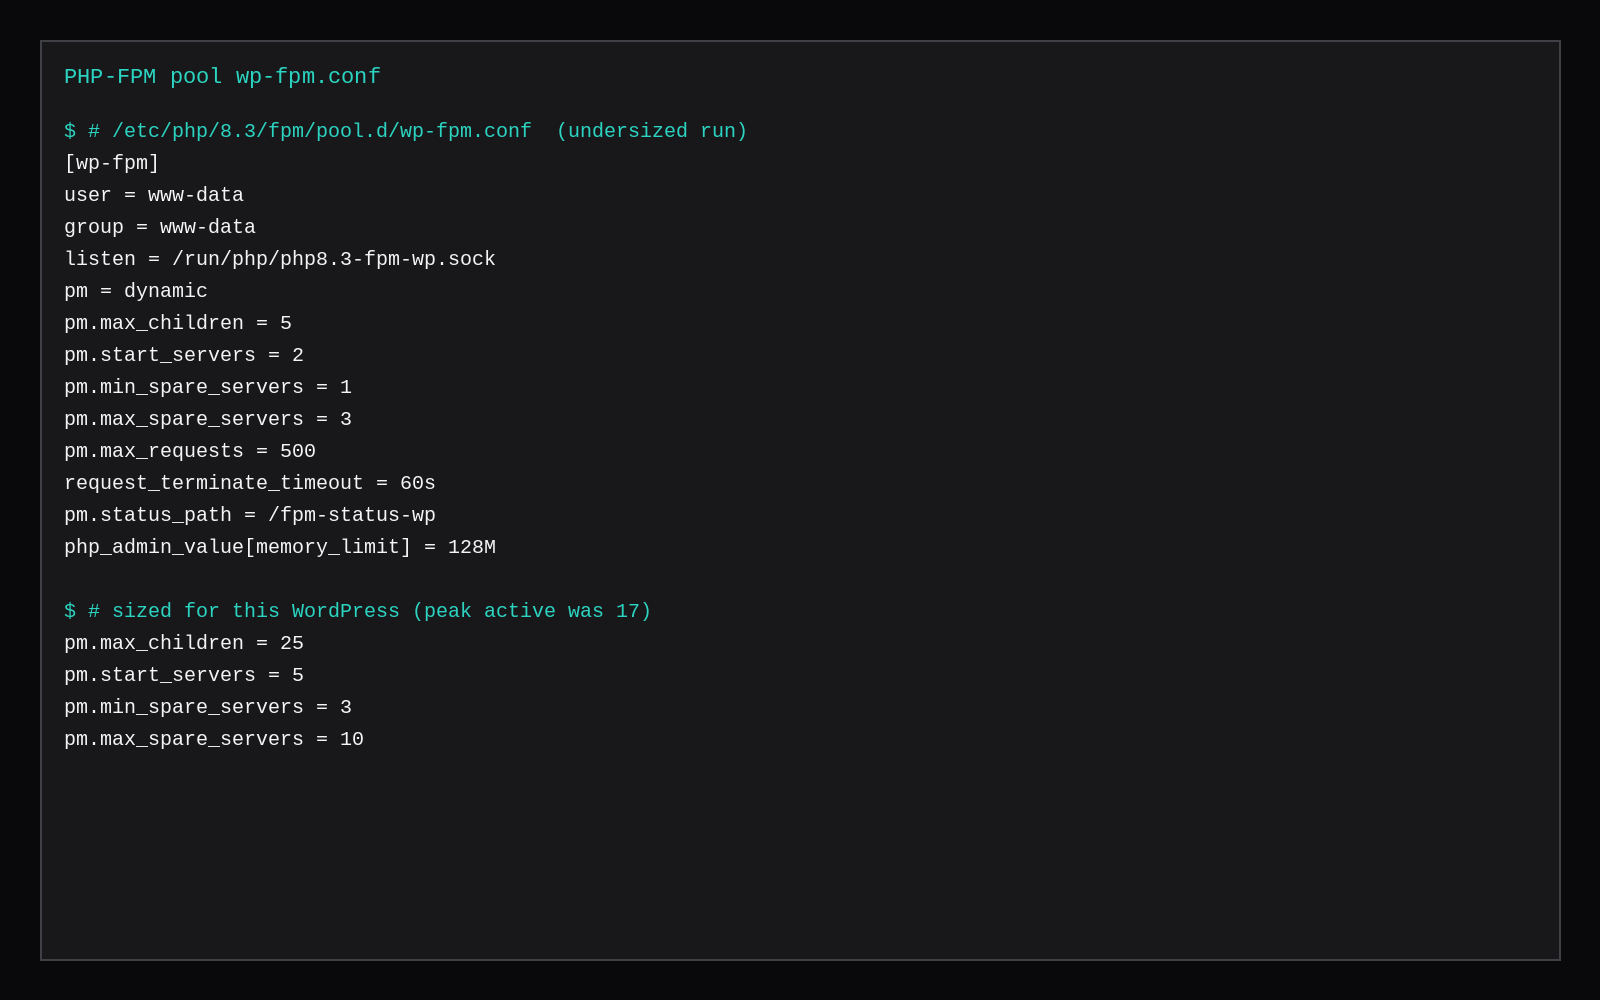
Dedicated pool for the site (Ubuntu 24.04 paths):
; /etc/php/8.3/fpm/pool.d/wp-fpm.conf
[wp-fpm]
user = www-data
group = www-data
listen = /run/php/php8.3-fpm-wp.sock
listen.owner = www-data
listen.group = www-data

pm = dynamic
pm.max_children = 25
pm.start_servers = 5
pm.min_spare_servers = 3
pm.max_spare_servers = 10
pm.max_requests = 500
request_terminate_timeout = 60s

pm.status_path = /fpm-status-wp
php_admin_value[memory_limit] = 128M
Point Nginx fastcgi_pass at that socket. Expose status only on loopback:
location ~ ^/(fpm-status-wp)$ {
    allow 127.0.0.1;
    deny all;
    include fastcgi_params;
    fastcgi_param SCRIPT_FILENAME $document_root$fastcgi_script_name;
    fastcgi_pass unix:/run/php/php8.3-fpm-wp.sock;
}
sudo systemctl reload php8.3-fpm
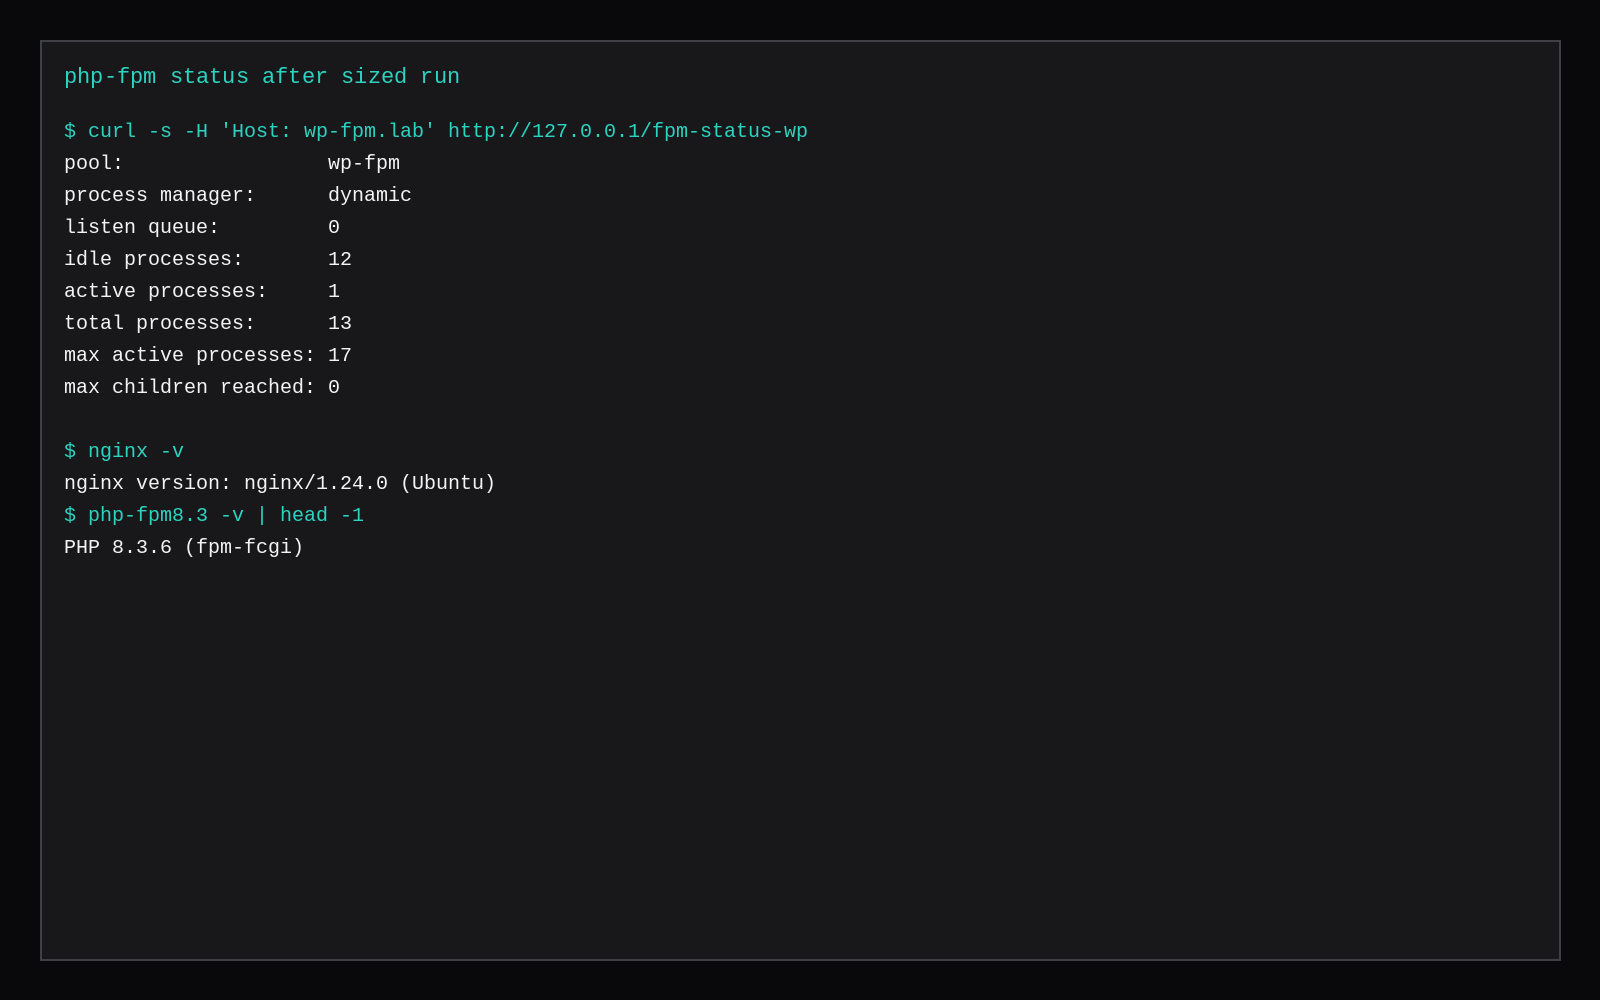
curl -s -H 'Host: wp-fpm.lab' http://127.0.0.1/fpm-status-wpWatch active processes, max active processes, and max children reached during a load run.
How the 50 concurrent run worked
ab -k -c 50 -n 500 -H 'Host: wp-fpm.lab' http://127.0.0.1/-c 50 keeps fifty clients in flight. -n 500 is enough for stable percentiles on this box. The homepage was Twenty Twenty-Five with no page-cache plugin. PHP 8.3.6-FPM, Nginx 1.24.0, MariaDB on localhost, WordPress 7.1.4.
With five children, every spike of concurrency sat on a full pool (max children reached: 1), so wait time piled into p95. With twenty-five, php-fpm grew to seventeen active workers and stopped. Fifty children never engaged the extra headroom on this URL.
Skip these
| Skip this | What to do |
|---|---|
Setting max_children = 50 because the headline says 50 | Size from RSS × headroom, then confirm with max active processes |
Using memory_limit as worker size | Measure RSS under WordPress load |
| Counting page-cache hits as FPM users | Measure uncached PHP (or logged-in) paths |
| Ignoring MariaDB RAM | Leave headroom; OOM kills the database first in practice |
Skipping pm.status_path | Read peak active and children reached from the status page |
Where this fits on a 2 GB VPS
A marketplace Compute Instance at 2 GB can serve this shape of WordPress when max_children sits near the measured peak (teens here) and MariaDB still has room. Fifty simultaneous heavy PHP requests that each hold a worker for a long time need more RAM, or a page cache for anonymous HTML. Build the stack with LEMP or the Nginx WordPress guide, then change the pool with numbers from your own status page.
pm = dynamic is not a free lunch
PHP-FPM pm.max_children is RAM math: roughly (available RAM for PHP) divided by average process size under your theme and plugins. Too low and visitors queue; too high and the OOM killer takes MySQL. pm = dynamic with sensible start_servers / min_spare_servers / max_spare_servers fits bursty WordPress; ondemand saves idle RAM on quiet sites at the cost of spawn latency. Watch php-fpm slow-log and listen.backlog when concurrency climbs. The 50-user lab number on this page is a measured starting point for that theme, not a universal formula.
FAQ
ondemand vs dynamic? ondemand spawns children on request and can save idle RAM; it adds spawn latency. This lab used dynamic. For a busy public site, dynamic (or static at the measured peak) is the usual choice.
Does object cache change max_children? Redis/Valkey object cache shortens PHP work; it does not remove the need for a child per in-flight PHP request. Peak active can drop a little; re-measure.
What about /wp-login.php? Often heavier than the homepage. Re-run ab against that URL if login is your real concurrency story.
pm.max_requests? Recycles workers to limit leaks. 500 is a reasonable starting point; it is unrelated to the 50-client ceiling.
The number on the tin is concurrent PHP work. Browsers parked on cached HTML barely count. Measure worker RSS, set max_children from RAM left for PHP, then prove it with ab -c 50 and max active processes on pm.status_path.