

Enzonix
Shared Compute - General Compute
$5.00/mo
1 vCPU · 1 GB · 20 GB
Choose location
Ashburn, United States
| Provider | Plan | vCPU | RAM | Disk | Regions | Billing | Price |
|---|---|---|---|---|---|---|---|
| Enzonix | Shared Compute - General Compute | 1 | 1 GB | 20 GB | Ashburn, United States | Fixed price | $5.00/mo |
| Enzonix | Shared Compute - General Compute | 1 | 1 GB | 20 GB | Amsterdam, Netherlands | Fixed price | $5.00/mo |
| Enzonix | Shared Compute - General Compute | 2 | 4 GB | 80 GB | Amsterdam, Netherlands | Fixed price | $9.00/mo |
| Enzonix | Shared Compute - General Compute | 2 | 4 GB | 80 GB | Ashburn, United States | Fixed price | $9.00/mo |
| Enzonix | Shared Compute - General Compute | 4 | 8 GB | 160 GB | Amsterdam, Netherlands | Fixed price | $16.00/mo |
| Enzonix | Shared Compute - General Compute | 4 | 8 GB | 160 GB | Ashburn, United States | Fixed price | $16.00/mo |
| Enzonix | Shared Compute - General Compute | 8 | 16 GB | 320 GB | Amsterdam, Netherlands | Fixed price | $32.00/mo |
| Enzonix | Shared Compute - General Compute | 8 | 16 GB | 320 GB | Ashburn, United States | Fixed price | $32.00/mo |
| Enzonix | Shared Compute - General Compute | 1 | 1 GB | 20 GB | Ashburn, United States | Hourly | $0.007/hr |
| Enzonix | Shared Compute - General Compute | 1 | 2 GB | 40 GB | Ashburn, United States | Hourly | $0.01/hr |
| Enzonix | Shared Compute - General Compute | 2 | 4 GB | 80 GB | Ashburn, United States | Hourly | $0.015/hr |
| Virtualized | Shared Compute - General Compute | 2 | 4 GB | 40 GB | Phoenix, United States | Fixed price | $12.49/mo |
| Virtualized | Shared Compute - General Compute | 3 | 6 GB | 60 GB | Phoenix, United States | Fixed price | $17.49/mo |
| Virtualized | Shared Compute - General Compute | 4 | 8 GB | 80 GB | Phoenix, United States | Fixed price | $22.99/mo |
| Virtualized | Shared Compute - General Compute | 8 | 16 GB | 160 GB | Phoenix, United States | Fixed price | $44.99/mo |
| Virtualized | Shared Compute - General Compute | 16 | 32 GB | 320 GB | Phoenix, United States | Fixed price | $79.99/mo |
| Virtualized | Shared Compute - General Compute | 32 | 64 GB | 640 GB | Phoenix, United States | Fixed price | $139.99/mo |
Grafana Instant App
Grafana is an open-source observability platform for metrics, logs and dashboards. Compare live VPS prices, CPU, RAM, disk and regions, launch Grafana on the plan you choose, and keep root access so your panels stay on your server.

Grafana
Instant App on marketplace VPS
Live marketplace offers
Choose billing and size, compare providers side by side, pick a location, then launch.
Shared Compute - General Compute
$5.00/mo
1 vCPU · 1 GB · 20 GB
Choose location
Ashburn, United States
1 provider
Grafana is a self-hosted dashboard platform for metrics, logs and traces. Use it instead of paying for Datadog or Grafana Cloud. Sign in as admin after boot, add a data source, and build panels. No Instant App form fields are required at create time. Public signup stays off.
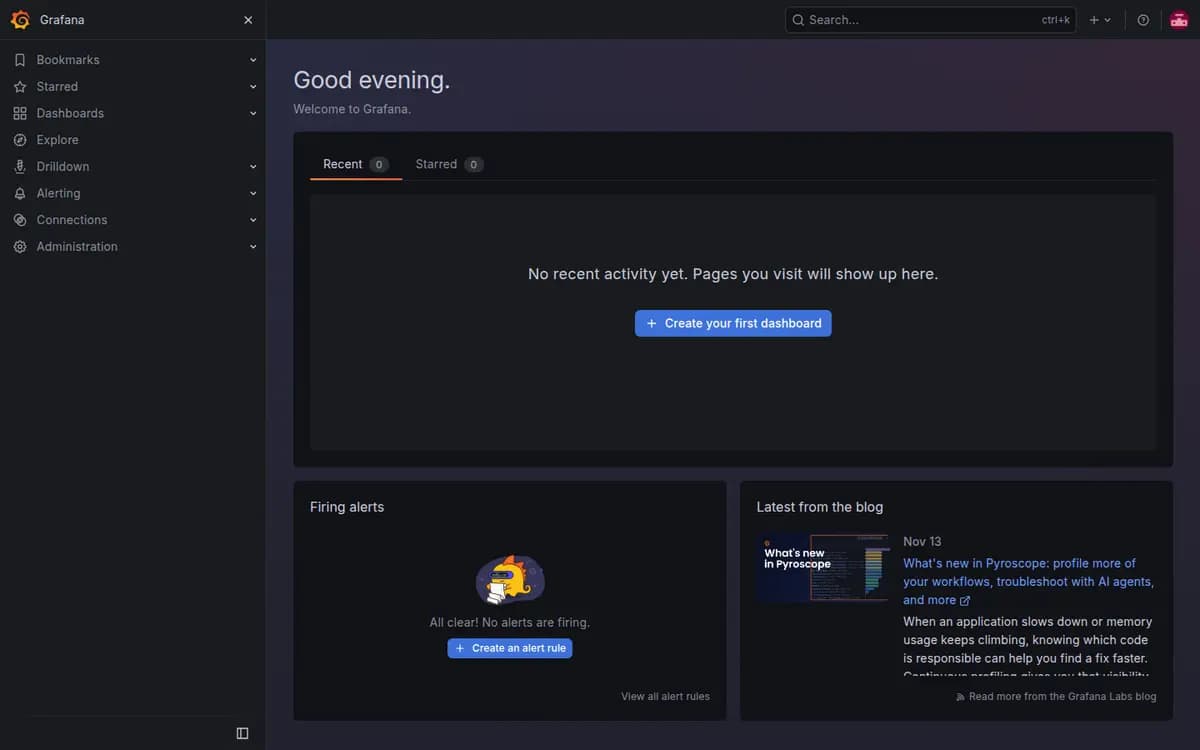
Open Grafana and sign in with the prepared admin account. Dashboards stay behind login on your VPS.
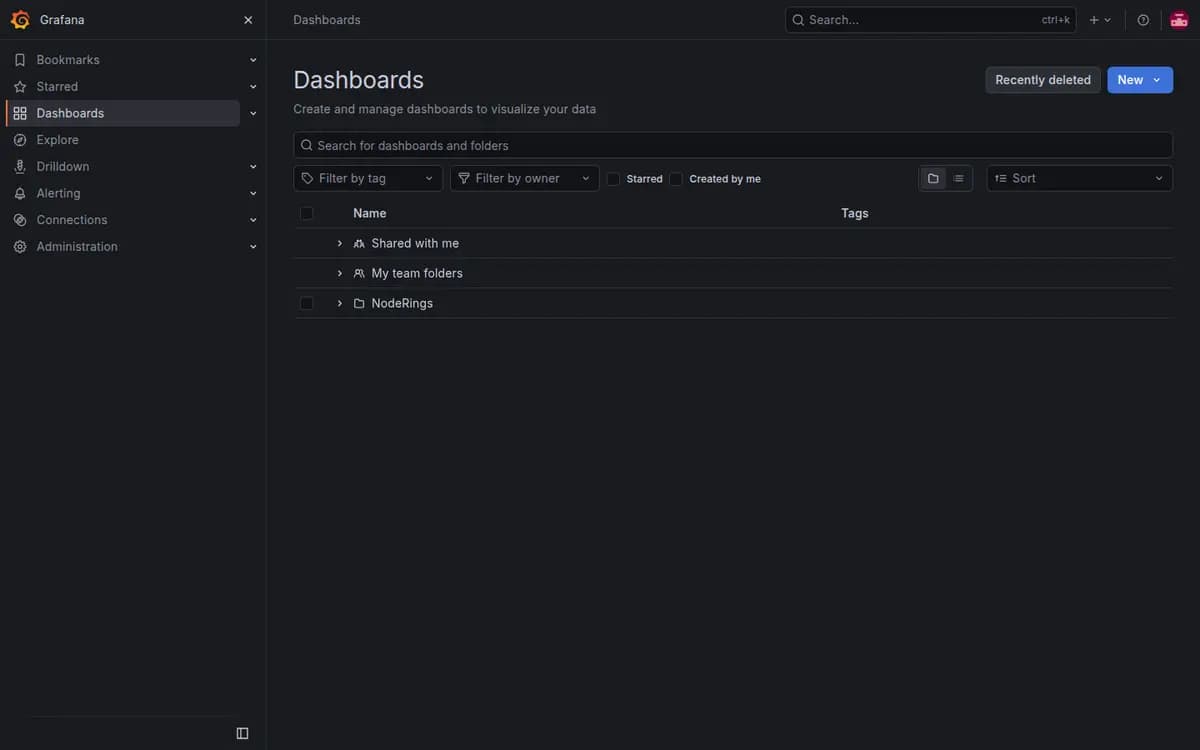
Build panels against Prometheus, Loki, Tempo and more. Keep the visualization layer on hardware you control.
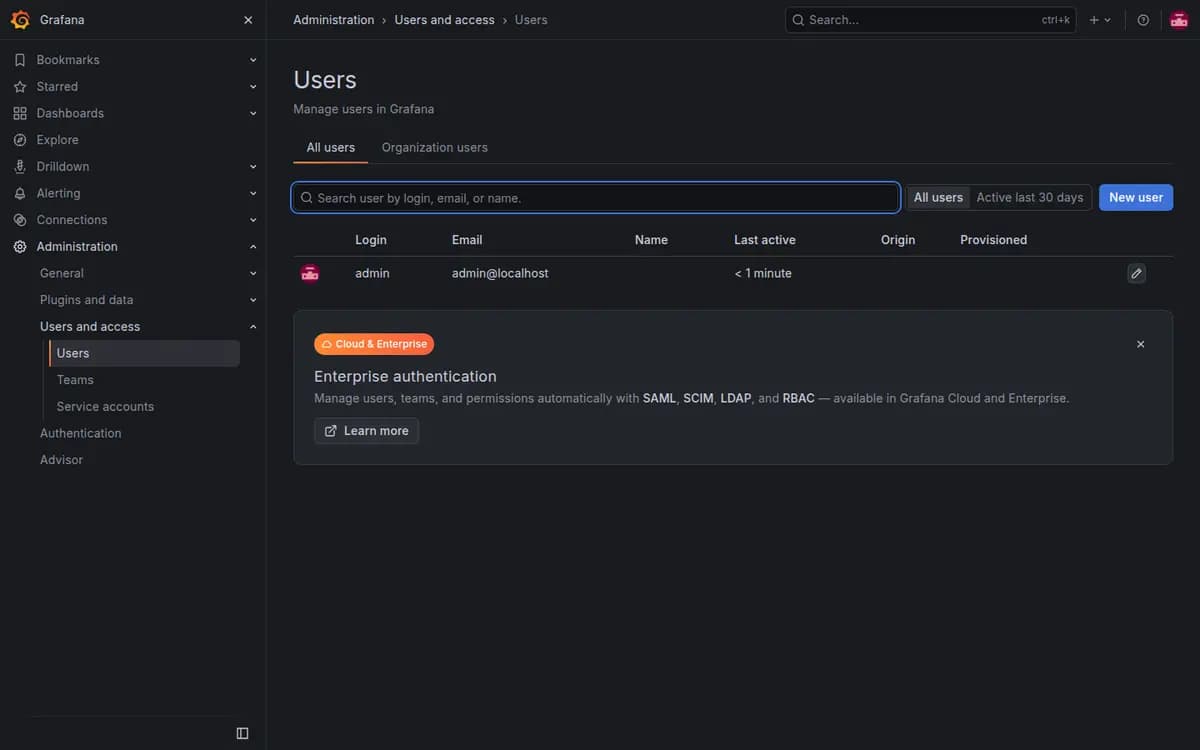
Manage users, orgs and plugins from Administration. Grow from a personal dashboard box to a team observability hub.
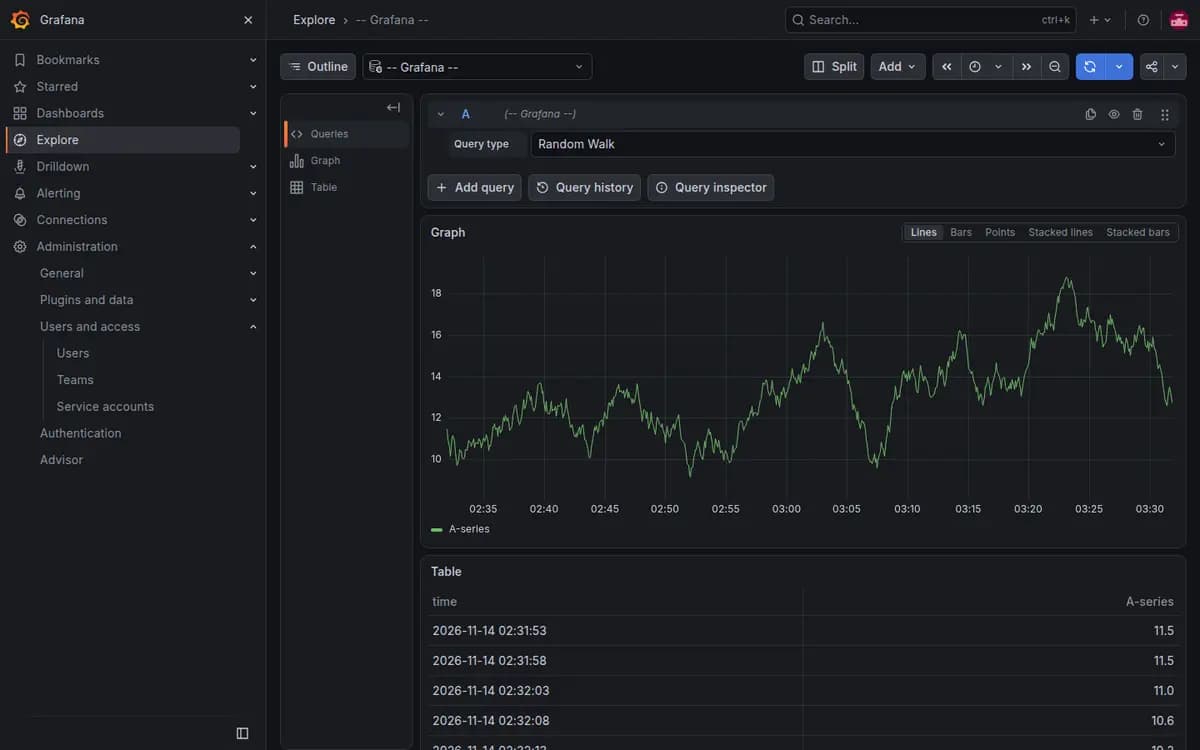
Query data sources with Explore as traffic grows. Keep search and panels on your VPS instead of a SaaS tenant.
Compare live Grafana VPS plans from independent providers, then self-host dashboards on the offer you pick. Use it instead of paying for Datadog or Grafana Cloud.
See live prices, regions and plan sizes before you buy. Shop observability hosts across independent providers, including 1 GB boxes that fit Grafana.
Pick a plan and Grafana is prepared on that VPS for you, including the admin account. You still get root access.
Compatible offers list cities and countries. Keep latency low for your team or keep metrics UI in a place that matches policy.
Dashboards, users and data-source configs live on your VPS volume. You control SSH, DNS and who can open Grafana.
Most Grafana VPS pages sell one company's servers. NodeRings lists Compute Instance plans from independent providers so you can compare self-hosted observability offers by price, size and region, then launch on the one that fits.
Grafana Instant App prepares Grafana on the provider VPS you selected. NodeRings does not operate that hardware or sell its own VPS fleet.
Compare plans, pick a provider offer, and launch Grafana on that server.
01
Browse live offers below. A 1 GB plan is a solid start for Grafana alone. Sort by provider, size, price and region.
02
Choose the provider plan and region. There are no Instant App form fields to fill for Grafana.
03
Confirm checkout and wait for the server. Then open the site URL and sign in with the admin username and password from your server notes. You keep root SSH.
NodeRings Instant App brings Grafana up with Docker and prepares first-boot access for you. Use the sections below to reach the UI, find passwords, and operate the stack.
Credentials are written on first boot to:
/root/.noderings_passwordRead them over SSH:
cat /root/.noderings_passwordCompose project directory
/opt/noderings/grafana
/opt/noderings/grafana/docker-compose.yml
/opt/noderings/grafana/.env
Working directory for compose, the stack file, and generated secrets.
Credentials file
/root/.noderings_passwordWritten once on first boot.
Boot unit
/etc/systemd/system/noderings-grafana.serviceBrings compose up after Docker is ready.
Compose runs a single Grafana server with data under /var/lib/grafana. The UI is on HTTP port 80 (container port 3000).
grafanaGrafana web UI and API on HTTP port 80.
Container status
cd /opt/noderings/grafana && docker compose psLive logs
cd /opt/noderings/grafana && docker compose logs -fRestart containers
cd /opt/noderings/grafana && docker compose restartsystemd unit status
systemctl status noderings-grafanaYour Grafana app starts on http://. Cloudflare can give visitors a padlock without installing anything on the VPS.
Add your domain
Sign up at Cloudflare and add the domain you want to use.
Point it at your VPS
Create an A record to your server IP and leave the orange cloud on.
Open the https site
Visit https://your-domain and sign in with the admin credentials from your server notes. If the UI misbehaves, update GF_SERVER_ROOT_URL in the .env to the https URL and recreate the Grafana container.
Only allow Cloudflare
Optional. With SSH (port 22) already allowed and everything else blocked by default, open only Cloudflare to ports 80 and 443:
curl -s https://www.cloudflare.com/ips-v4 | while read ip; do sudo ufw allow from "$ip" to any port 80,443 proto tcp; doneThat is enough for a first secure visit. You can tighten SSL in Cloudflare later if you need it. Keep port 22 allowed for SSH; leave other ports denied except this Cloudflare allow for 80 and 443.
Grafana is a light Go/Node UI with SQLite by default. A quiet personal dashboard needs about 1 GB of RAM; busy multi-user orgs with many plugins need headroom. Metrics backends (Prometheus, Loki) are separate. These are starting points, not guarantees.
| Workload | Illustrative starting point | Note |
|---|---|---|
| Personal or small team dashboards | 1 vCPU / 1 GB RAM / 20+ GB disk | Suggested Instant App floor for Grafana with SQLite. |
| Active team with many dashboards | 1–2 vCPU / 2 GB RAM | More headroom when many editors and plugins are open at once. |
| Plugins and image rendering | 2 GB+ RAM; disk for plugins | Heavy plugins and the image renderer need extra RAM. |
| External database (optional) | Same size; Postgres elsewhere | Default Instant App uses SQLite. Point Grafana at Postgres later if you outgrow it. |
These are starting points, not guarantees. Needs depend on user count, plugins and how much data you query through Grafana.
This is self-hosted Grafana on a provider VPS, not managed Grafana Cloud. You pick the plan. Grafana is prepared on that server. Day-to-day care stays with you.
Grafana is prepared on the VPS with no Instant App form variables. The admin account is created for you via GF_SECURITY_ADMIN_* on first boot. Public signup is disabled.
Root SSH on the VPS. You own dashboards, users, data sources, DNS, TLS, OS updates and backups unless a provider product says otherwise.
Managed Prometheus/Loki, automatic TLS and Grafana Cloud features are not bundled in. Add data sources and finish TLS after the server is up if you need them.
NodeRings helps with marketplace, billing and console. Provider hardware issues go to that provider. Looking after Grafana on the server is yours.
Grafana is a free, open-source observability platform. Teams use it for dashboards, alerts and Explore queries against metrics and logs on hardware they control.
No. Grafana Instant App asks for no form variables at create time. After the VPS is ready, sign in with the admin username and password from your server notes.
No. NodeRings is a marketplace. Independent providers list VPS plans. You pick a plan, Grafana is prepared on that provider server, and you manage dashboards from there.
No. You get a virtual machine with Grafana prepared for you, plus root access. That is different from Grafana Cloud or a managed product that owns updates and support for you.
It prepares Grafana on the VPS you choose so you skip hunting through install guides by hand. It is still your self-hosted server, not a separate managed hosting brand.
Open http://YOUR_IP/ and sign in with grafana_admin_user and grafana_admin_pass from /root/.noderings_password. Public signup is disabled on purpose.
Yes. Sign in and change the password in your profile. GF_SECURITY_ADMIN_* only applies when the database is first created.
A common starting point is about 1 vCPU, 1 GB RAM and 20 GB disk for Grafana alone. Larger teams and plugins usually need more RAM. Use the sizing guide above and compare plans in the list.
You confirm the plan and finish checkout. When the server is ready, open the site URL and sign in with the admin credentials from your server notes.
Yes. Each compatible plan lists available regions. Pick the city or country that matches latency and compliance needs.