
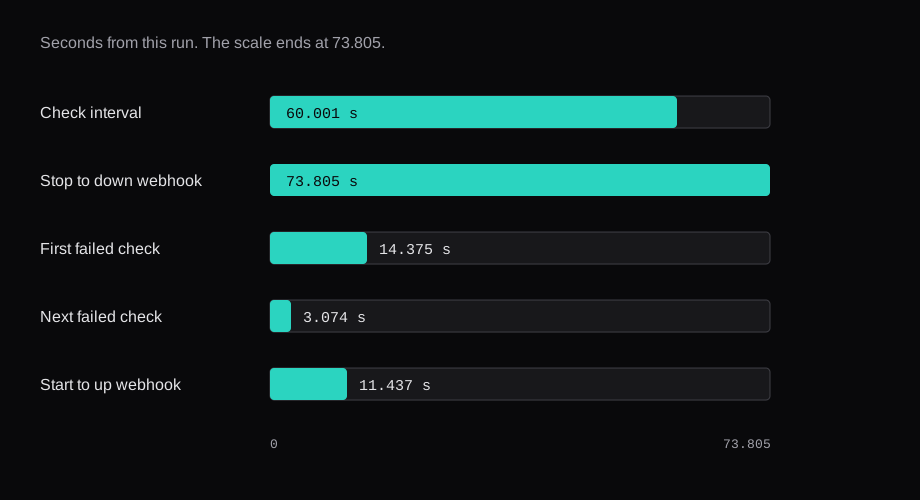
docker stop of the whoami container returned in 0.182 seconds. The webhook with heartbeat status 0 arrived 73.805 seconds after that command started. A plain SMTP listener on the same guest got the outage 56 ms later. docker start returned in 0.207 seconds, and the webhook with status 1 arrived 11.437 seconds after the start command. The 60 second interval is most of both waits. On the way down, the failed connect itself took 14.375 seconds.
This was Uptime Kuma 2.5.9, package.json and the log line Uptime Kuma Version: 2.5.9, on Node v22.23.4. The guest was Ubuntu 24.04.5 LTS, kernel 6.8.0-147-generic, qemu -m 2048 -smp 2. MemTotal was 2,014,852 kB. SwapTotal was 0. Docker was 29.1.3-0ubuntu3~24.04.2 and Compose was 2.40.3+ds1-0ubuntu1~24.04.1. The image digest was sha256:e88415a90dd2f7efecdbc18de0490aff292764a3ac471531bf1d0481725591bd.
| On this guest | |
|---|---|
| Image | louislam/uptime-kuma:2.5.9, inspect Size 617,153,319 bytes |
| Database | SQLite, kuma.db 286,720 bytes |
| Monitor | http://whoami:80/, interval 60, maxretries 0, timeout 48 |
docker stop to the down webhook | 73.805 seconds |
docker stop to the down SMTP DATA | 73.861 seconds |
docker start to the up webhook | 11.437 seconds |
docker start to the up SMTP DATA | 11.515 seconds |
memory.current | 213,725,184 bytes on four of five reads |
What does the 2.5.9 compose file publish?
The compose file at tag 2.5.9 still says image: louislam/uptime-kuma:2 and "3001:3001". That tag floats, and that port line listens on every interface. I pinned louislam/uptime-kuma:2.5.9 and published 127.0.0.1:3001:3001. The GitHub API listed stargazers_count 93190 for louislam/uptime-kuma, license MIT.
ss showed LISTEN on 127.0.0.1:3001 with backlog 4096. ufw status was Status: inactive. The bind address is what kept the port off the other interfaces. The Compose checklist is the post that measured a firewall against a scan.
The file I ran:
services:
  uptime-kuma:
    image: louislam/uptime-kuma:2.5.9
    restart: unless-stopped
    volumes:
      - ./data:/app/data
    ports:
      - "127.0.0.1:3001:3001"
    extra_hosts:
      - "host.docker.internal:host-gateway"
  whoami:
    image: traefik/whoami:v1.10.3
sudo docker compose up -dwhoami's inspect Size was 2,853,860 bytes, digest sha256:43a68d10b9dfcfc3ffbfe4dd42100dc9aeaf29b3a5636c856337a5940f1b4f1c. After the pull, Kuma's container IP was 172.18.0.3 and whoami's was 172.18.0.2, on 172.18.0.0/16, gateway 172.18.0.1. docker inspect reported restart policy unless-stopped, RestartCount 0, and health healthy. The image healthcheck is extra/healthcheck. The inspect fields were Interval 60000000000 (60 seconds), Timeout 30000000000 (30 seconds), StartPeriod 180000000000 (180 seconds), Retries 5.
The first HTTP answer from port 3001 was the database setup, before any admin account existed. GET /setup-database-info returned needSetup true and isEnabledEmbeddedMariaDB true. I posted {"dbConfig":{"type":"sqlite"}}. The response was {"ok":true}. The next GET was a connection reset, and the one after that had needSetup false. The SQLite file is /app/data/kuma.db in the volume. On the host that was kuma.db at 286,720 bytes, and du -B1 -s of the data directory was 1,634,304 bytes.
The admin account went in through the setup socket after that. The password stays off this page. A monitor saved through the same socket had url http://whoami:80/, interval 60, retryInterval 60, resendInterval 0, maxretries 0, timeout 48, method GET, accepted status 200-299. Those interval fields match the defaults in the new-monitor form. domainExpiryNotification on that form defaults to true. I saved false, so the expiry lookup is off for this monitor.

Five reads of the container cgroup memory.current, five seconds apart, were 213,725,184 bytes four times and 213,733,376 bytes on the last read. The last MemAvailable on the guest was 1,424,152 kB. That is a short sample after the checks had already run, on a 2 GB guest. The 2.5.8 post has the longer idle reading and the ntfy topic.
How long from docker stop to the down message?
The monitor's first row was status 1, msg 200 - OK, ping 5. docker stop kuma-whoami-1 then returned in 0.182 seconds, and docker ps showed Exited (2) while it stayed down. The next row's time is 60.001 seconds after the up row's time, and 59.487 seconds after the stop command started. That gap is the schedule. maxretries was 0, and the failed rows are status 0.
That down row's msg is connect EHOSTUNREACH 172.18.0.2:80. 172.18.0.2 is the address dns.lookup("whoami") returned from inside the Kuma container after the container was back, and it is the address in the error while it was stopped. end_time on that row is 14.375 seconds after time. The saved timeout is 48, and 14.375 sits inside that cap. The next three down rows, same msg, span 3.074, 3.105, and 3.072 seconds from time to end_time.
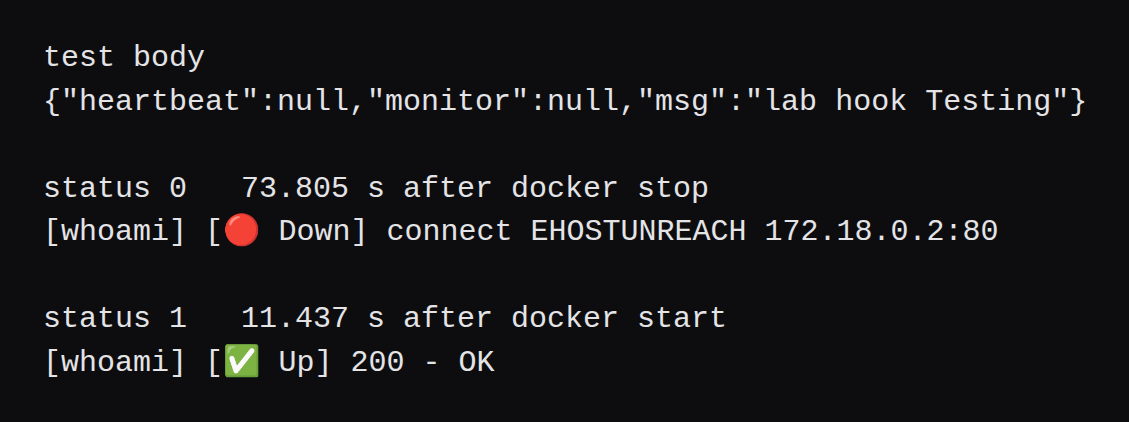
The webhook listener wrote one body with status 0:
[whoami] [🔴 Down] connect EHOSTUNREACH 172.18.0.2:80That write was 73.805 seconds after docker stop started, and 57 ms before the row's end_time. The SMTP sink wrote the same outage 56 ms after the webhook. Its subject decoded to whoami 🔴 Down, and the body was the line above. The monitor's retries column on that first down row is 1, then 2, 3, and 4. resendInterval is 0. The later three rows are important 0. The hooks file still has one status 0 body.
host.docker.internal inside the Kuma container resolved to 172.17.0.1. The compose gateway was 172.18.0.1. A probe POST to http://host.docker.internal:9999/hook returned 204 in 0.125 seconds, so the alerts used that path. From the same container, http://127.0.0.1:80/ was ECONNREFUSED and http://127.0.0.1:3001/ returned 200. In that namespace, port 3001 is Kuma.
Before the stop, the webhook test returned Sent Successfully. The body on the listener was {"heartbeat":null,"monitor":null,"msg":"lab hook Testing"}. The SMTP test subject decoded to Monitor Name not available ⚠️ Test, and the body was lab smtp Testing. Every SMTP send logged SMTP notification using unencrypted connection (STARTTLS disabled) to host.docker.internal:2525. The sink is plain SMTP on port 2525, with STARTTLS turned off on the notification.
What arrived when whoami came back?
docker start kuma-whoami-1 returned in 0.207 seconds. The up row's time is 60.001 seconds after the previous down row, and 11.428 seconds after the start command. Ping on that row is 2. end_time is 88 ms after time.
The up webhook was 11.437 seconds after docker start, which is 9.6 ms after that row's time:
[whoami] [✅ Up] 200 - OKThe SMTP sink logged it 78 ms after the webhook, 88 ms after the row's time. The subject decoded to whoami ✅ Up. The hooks file has one status 1 body. Four status 0 rows were already stored. The start command was 11.428 seconds old, and the up message left on that next check.
What does the public status page return?
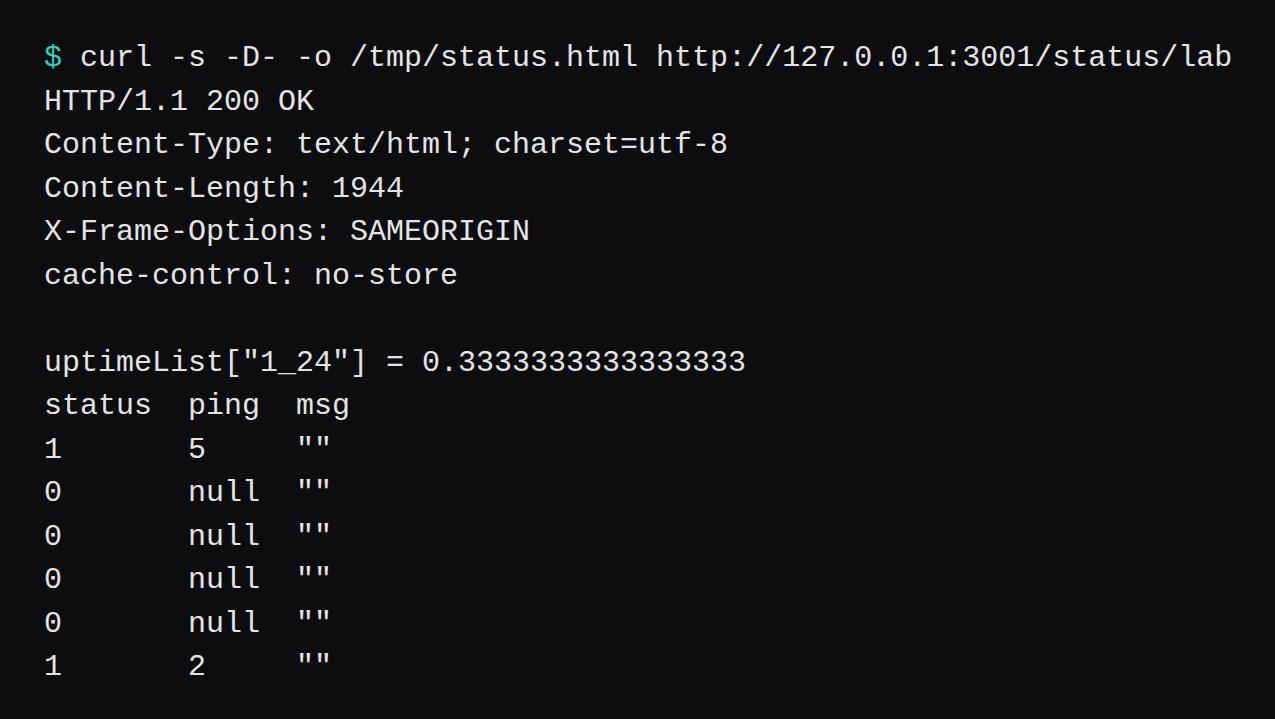
addStatusPage with title Lab and slug lab returned ok. The public group was Services, with the whoami monitor and sendUrl 0. GET /status/lab returned HTTP 200, text/html; charset=utf-8, 1944 bytes, <title>Lab</title>, X-Frame-Options: SAMEORIGIN, cache-control: no-store. GET /api/status-page/lab returned 200. That request carried no Cookie header and no Authorization header. published was true, theme was auto, autoRefreshInterval was 300, showPoweredBy was true, and icon was /icon.svg.
GET /api/status-page/heartbeat/lab is the 24-hour figure. The route sets uptimeList["${monitorID}_24"] from get24Hour().uptime. While whoami was still down, that value was 0.2 and the list had five rows, statuses 1, 0, 0, 0, 0. After the up row, the value was 0.3333333333333333 and the statuses were 1, 0, 0, 0, 0, 1. Pings were 5, then null on the down rows, then 2. Every public msg was an empty string. In 2.5.9, toPublicJSON sets msg to "" with the comment Hide for public. The error string was in the webhook, and it was blank on this URL.
The same port serves the login and this JSON. On this guest the status page was HTTP. Caddy with a hostname is what puts a certificate in front of a name. This compose file is Kuma and whoami.
FAQ
Does the alert leave as soon as the container stops?
The stop command returned in 0.182 seconds. The next check started 59.487 seconds later, and that check's end_time was 14.375 seconds after its time. The webhook is 73.805 seconds after the stop command, 57 ms before end_time.
Will it send again on every failed check?
resendInterval was 0. Four down rows are in the database. The listener has one body with status 0. The later rows are important 0, and their retries values are 2, 3, and 4.
Is the up message the same kind of wait?
The up check started 11.428 seconds after docker start, one interval after the previous down row. Ping was 2. The webhook was 9.6 ms after the row's time, and the SMTP line was 88 ms after it.
Can I follow this for Telegram or Discord?
The notification rows here are the webhook and the SMTP sink on port 2525. Telegram wants a bot token. Discord wants a webhook URL. This guest had neither, so those two rows are absent. The test webhook body was {"heartbeat":null,"monitor":null,"msg":"lab hook Testing"}.
Does the floating image tag matter?
The compose file at tag 2.5.9 says louislam/uptime-kuma:2. This guest ran louislam/uptime-kuma:2.5.9, digest sha256:e88415a90dd2f7efecdbc18de0490aff292764a3ac471531bf1d0481725591bd, Node v22.23.4.