
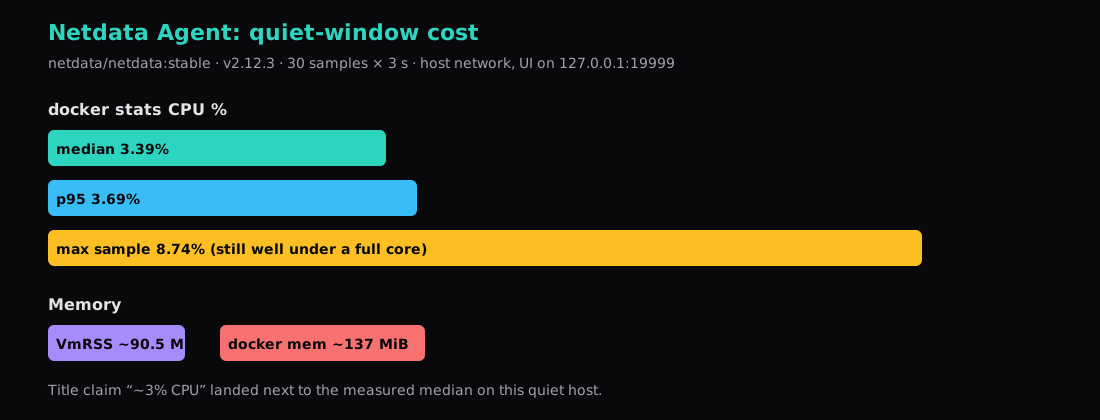
Netdata Agent v2.12.3 (netdata/netdata:stable, digest sha256:c7eab00e20901eb60595ebae0fbfe88e59464e663924461874719d40de0735d2) sat on this host with a quiet-window median of 3.39% CPU in docker stats (30 samples, 3 seconds apart). p95 was 3.69%. One sample peaked at 8.74%. Process VmRSS median was about 90.5 MiB; docker reported about 137 MiB. The dashboard listened on 127.0.0.1:19999 only. Cloud claim stayed unset (claim_id null in /api/v1/info).
That is roughly the “~3% CPU” line people quote when they install Netdata. On this quiet box it held.
| Reading | Value |
|---|---|
| Image | netdata/netdata:stable → v2.12.3 |
| CPU median / p95 / max | 3.39% / 3.69% / 8.74% |
| VmRSS median | ~90.5 MiB |
| docker mem median | ~137 MiB |
| Listener | 127.0.0.1:19999 |
What you are paying for
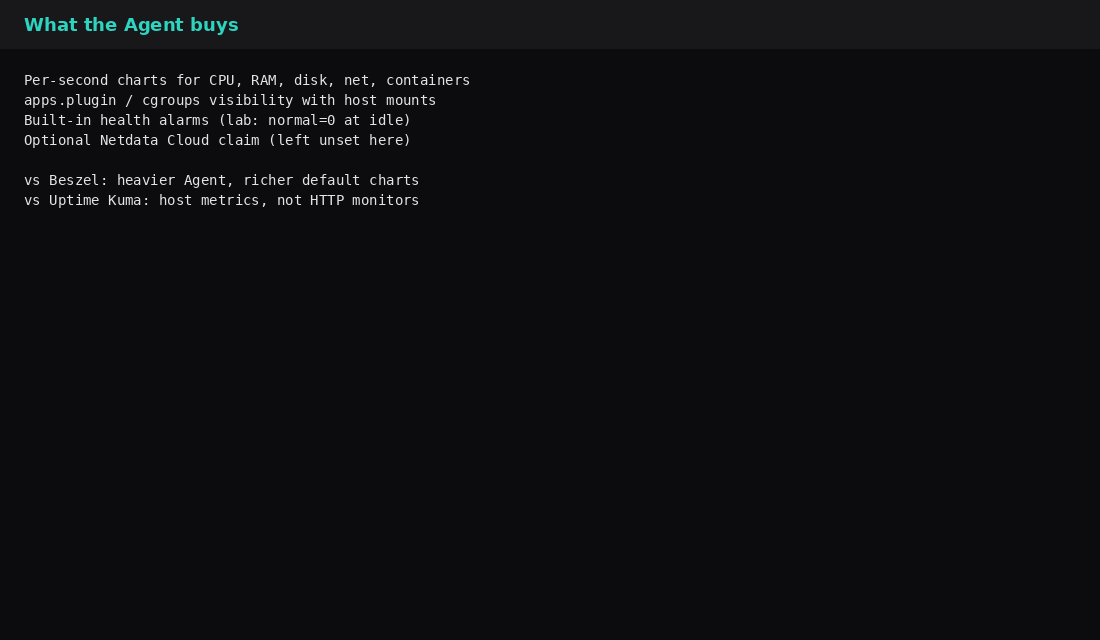
Per-second charts for CPU, RAM, disk, network, and containers, plus the Agent’s collectors and built-in health checks. Beszel is the thinner hub/agent graph on this site. Uptime Kuma watches URLs and keywords. Netdata is the always-on host microscope: more collectors, more RAM, and a steady few percent of a core while nothing special is happening.
Install with host visibility and a private UI
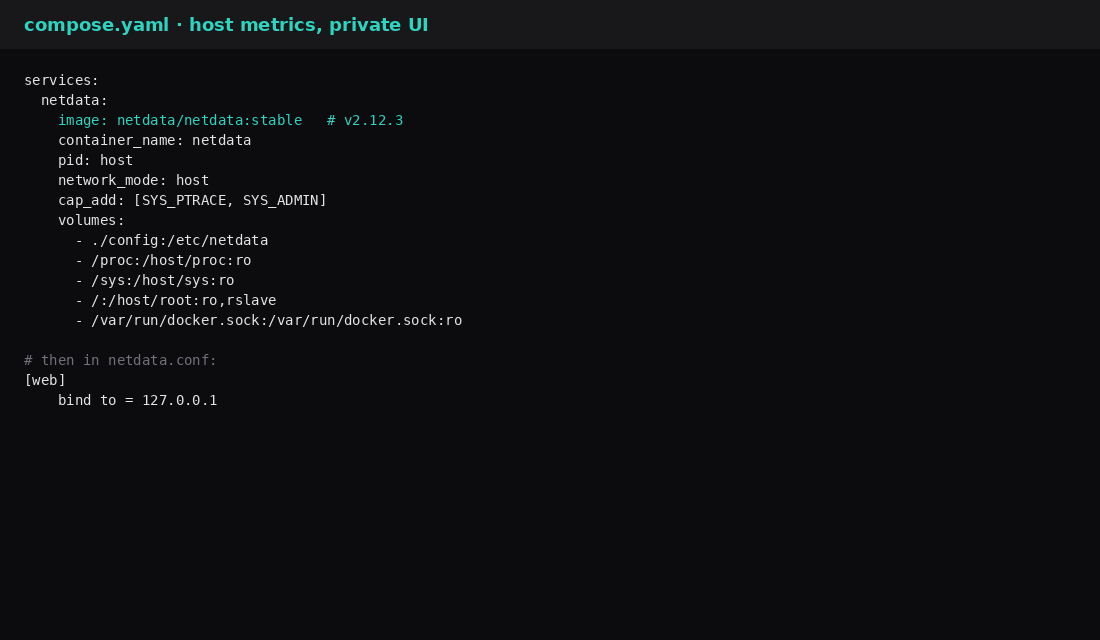
Official Docker guidance uses host PID/network and read-only host mounts so cgroups and apps show up. This lab followed that shape, then locked the web server to loopback.
# compose.yaml (lab)
services:
  netdata:
    image: netdata/netdata:stable
    container_name: netdata
    pid: host
    network_mode: host
    restart: unless-stopped
    cap_add:
      - SYS_PTRACE
      - SYS_ADMIN
    security_opt:
      - apparmor:unconfined
    volumes:
      - ./config:/etc/netdata
      - ./lib:/var/lib/netdata
      - ./cache:/var/cache/netdata
      - /:/host/root:ro,rslave
      - /etc/passwd:/host/etc/passwd:ro
      - /etc/group:/host/etc/group:ro
      - /proc:/host/proc:ro
      - /sys:/host/sys:ro
      - /etc/os-release:/host/etc/os-release:ro
      - /var/run/docker.sock:/var/run/docker.sock:ro
docker compose up -d
# after first start, pin the UI:
# config/netdata.conf → [web] / bind to = 127.0.0.1
docker compose restart[web]
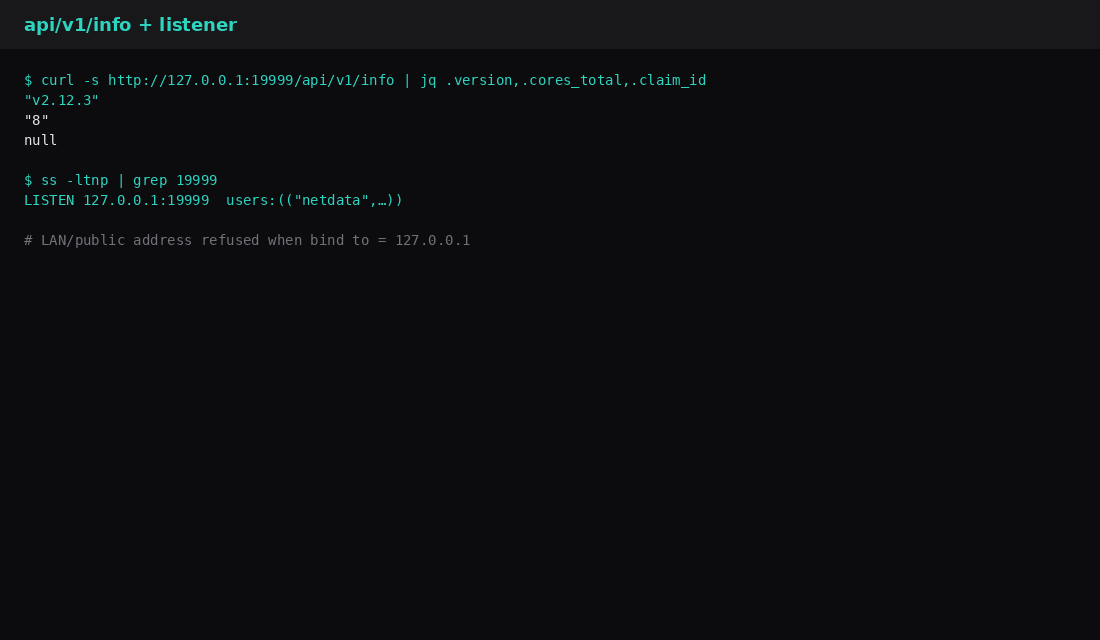
bind to = 127.0.0.1curl -s http://127.0.0.1:19999/api/v1/info | jq '.version,.cores_total'
# "v2.12.3"
# "8"
ss -ltnp | grep 19999
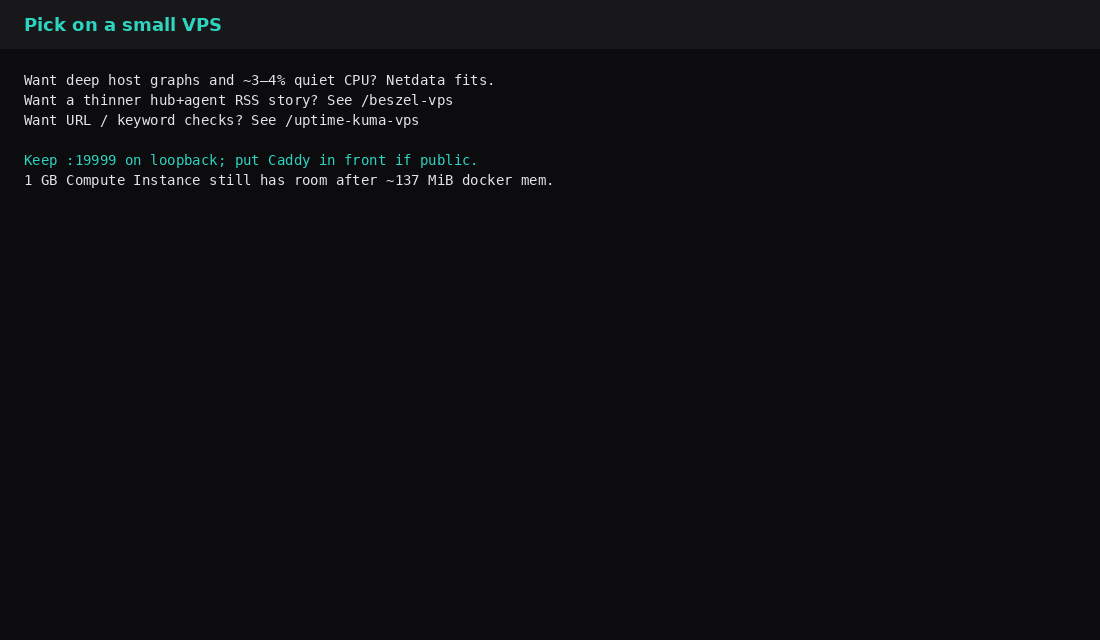
# LISTEN 127.0.0.1:19999 …Host networking means the Agent sees the real interfaces; bind to is what keeps strangers off the dashboard. Put Caddy in front when you need a hostname. Leave Netdata Cloud claim tokens empty until you want that path.
How the quiet window was measured
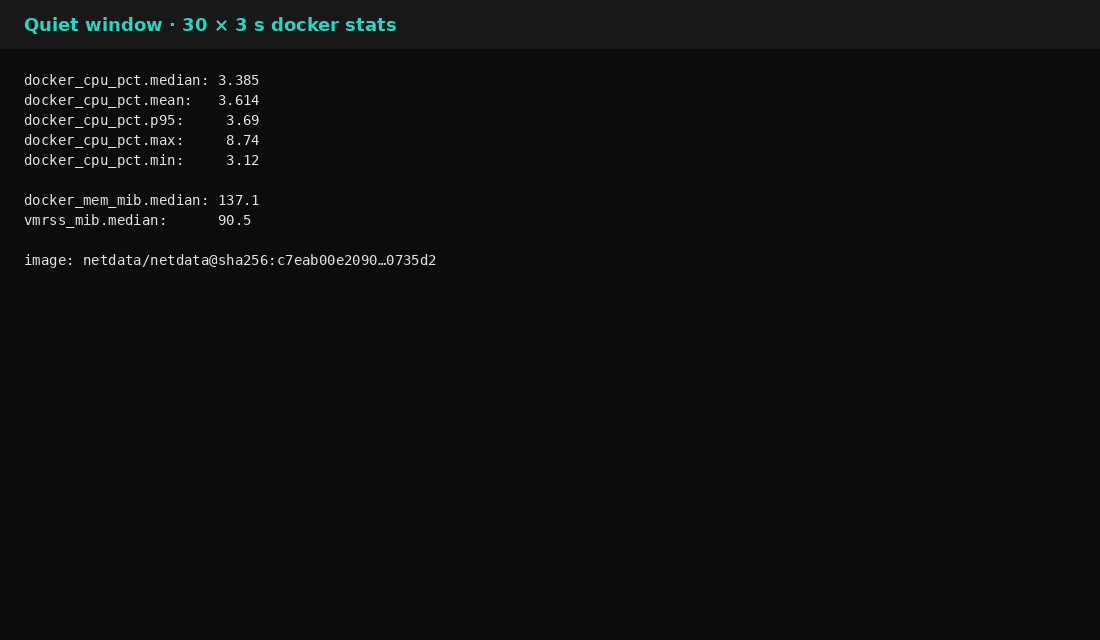
Thirty docker stats --no-stream samples on the netdata container, three seconds apart, while nobody was clicking charts. CPU% from docker, memory from docker, and VmRSS from /proc/<pid>/status for the main netdata process. No load generator. One later curl of / left the median story alone (CPU still ~3.4%).
| Stat | Quiet window |
|---|---|
| Samples | 30 × 3 s |
| CPU median | 3.39% |
| CPU mean | 3.61% |
| CPU p95 | 3.69% |
| CPU max | 8.74% |
| docker mem median | 137.1 MiB |
| VmRSS median | 90.5 MiB |
When the percentage climbs
Opening dense charts, enabling more collectors, or pointing many child Agents at one parent will spend more CPU than a quiet window. The title’s “3 percent” is a quiet-host check. A busy UI session will sit higher. If you need a hard ceiling, systemd/docker CPU quotas work; measure first so you know what you are capping.
Pick on a small VPS
| Need | Lean |
|---|---|
| Deep host graphs, accept ~3–4% quiet CPU | Netdata |
| Thinner hub + agent RSS story | Beszel |
| HTTP / keyword / status page | Uptime Kuma |
| Cron heartbeats | Healthchecks |
| Skip this | What this lab did |
|---|---|
Publishing 19999 on 0.0.0.0 | bind to = 127.0.0.1 |
| Claiming to Cloud on day one unread | Left claim tokens empty |
| Treating marketing “1%” as measured | Sampled docker stats for ~90 s |
| Bridge-only install while expecting full host cgroups | Host pid/network + /host/proc |
| Alerting only from the dashboard tab | Use health + ntfy/Kuma if you need push |
What Netdata’s own sizing pages say
Netdata’s resource docs put a Child/standalone agent with defaults at about 1–5% of one CPU core, including per-second collection, database tiers, alerts, optional ML, and streaming to a Parent. Empty cloud VMs in their impact notes often sit near 100–200 MB RAM and a few KiB/s of disk I/O; production boxes with more collectors land nearer 250–350 MB and 5–20% of one core. Rare flush spikes can touch ~20% for a moment every fifteen minutes or so.
The knobs that move the bill are metric count, update every (raising from 1s toward 2s roughly halves collection CPU), database tiers/retention (~4 GiB of metrics+metadata is a common default footprint), and machine learning. Parent agents that ingest many Children scale with samples per second, not with “one more dashboard.” If this lab’s quiet percentage looked lower than a busy production host, that is expected: fewer collectors and a short quiet window. Trim collectors and retention before you blame the VPS size.
FAQ
Is docker CPU% the same as top? Close enough for sizing. docker aggregates the container; VmRSS is the main Agent process. Quote both if someone argues.
Do I need privileged mode? This compose uses specific capabilities and AppArmor unconfined instead of privileged: true. Match current Netdata Docker docs if your kernel complains.
Parent/child streaming? A different RAM/CPU profile. This post is one Agent on one VPS.
Will 1 GB RAM hold it? ~137 MiB docker mem leaves room next to a small app stack. Still bind loopback and watch the quiet median after install.
What to run on the VPS
On a 1–2 GB Compute Instance, pin netdata/netdata by digest, use host mounts if you want container charts, set bind to = 127.0.0.1, and re-sample docker stats after a day of real use. Keep the UI behind SSH or Caddy. If a few percent of a core feels high for the charts you actually open, switch to Beszel and keep Netdata for the box that needs the microscope.