
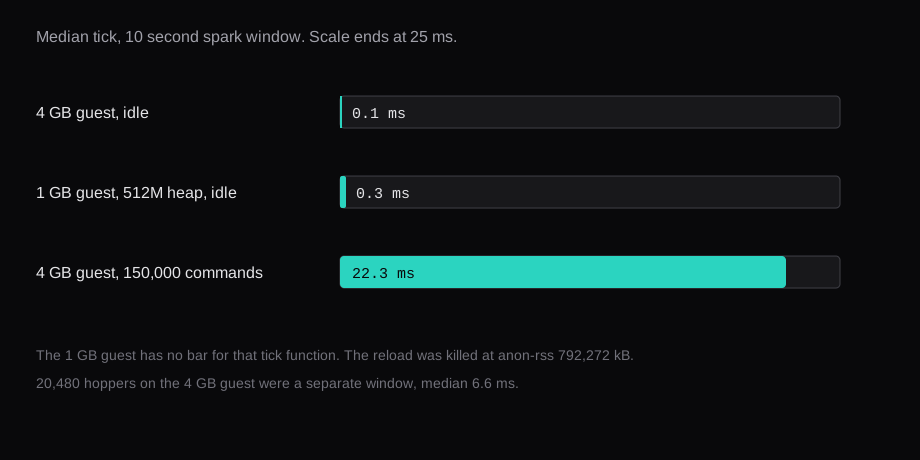
Ibrahim Babal's Google Cloud tutorial starts an e2-medium and runs java -Xmx1024M -Xms1024M -jar server.jar nogui. I ran that heap on two qemu guests shaped like the published machines. On the 4 GB guest, CPUQuota=100%, Paper stayed at 20.0 TPS. With a 150,000-command tick function the 10 second median was 22.3 ms. On the 1 GB guest, CPUQuota=25%, the same 1024M heap was killed by the kernel at anon-rss 789,080 kB, before Done.
This lab is qemu. The dollar figures are the Iowa cells on the general-purpose price page.
| Guest | Heap | CPUQuota | 10 second tick, min / med / 95th / max | 10 second TPS | What the process did |
|---|---|---|---|---|---|
qemu -m 4096, MemTotal 4,009,864 kB | -Xmx1024M | 100% | 0.1 / 0.1 / 0.2 / 0.3 ms, world empty | 20.0 | Stayed up |
| Same 4 GB guest | -Xmx1024M | 100% | 4.4 / 6.6 / 7.3 / 10.1 ms, 20,480 hoppers | 20.0 | Stayed up. I removed the hoppers after this sample |
| Same 4 GB guest | -Xmx1024M | 100% | 19.0 / 22.3 / 32.1 / 48.0 ms, 150,000 commands a tick | 20.0 | Stayed up. ps RSS 1,419,944 kB |
qemu -m 1024, MemTotal 984,196 kB | -Xmx1024M | 25% | No sample | oom-kill. anon-rss 789,080 kB | |
| Same 1 GB guest | -Xmx512M | 25% | 0.2 / 0.3 / 0.5 / 9.2 ms, world empty | 20.0 | Done (89.190s). ps RSS 702,916 kB |
| Same 1 GB guest, datapack reloaded | -Xmx512M | 25% | No sample | Stopped answering, then oom-kill at anon-rss 792,272 kB |
What machine does that tutorial actually create?
The post puts the VM on the $300 Welcome credit, which Google's free trial page describes as 90 days of credit with no bill during the trial. He picks Compute Engine, machine type e2-medium, the region closest to him, and the HTTP and HTTPS firewall checkboxes. Java comes from sdkman, with no version pinned. The server jar is Mojang's server.jar. ufw is opened for 25565/tcp and 22/tcp. A VPC rule named minecraft-server-rule allows tcp:25565 from 0.0.0.0/0. The process sits in screen. The post then says to back the world up and keep running the server for free.
The shared-core table is where the tutorial machine and the free tier split. e2-medium is 2 vCPUs, a fractional vCPU of 1, and 4 GB of memory. e2-micro is 2 vCPUs, a fractional vCPU of 0.25, and 1 GB. The guest OS is shown 2 vCPUs either way. The sustained shares are 100% of one core for e2-medium (each of 2 vCPUs at 50%) and 25% of one core for e2-micro (each at 12.5%). Both can burst to 100% CPU, for about 120 seconds on e2-medium and about 30 seconds on e2-micro, from a token bucket. Bursts stay on the listed on-demand price. The quota stayed capped for the whole run, so the tick times below are the sustained share.
Always Free compute, on the same free trial page, is one non-preemptible e2-micro in us-west1, us-central1, or us-east1, for a number of hours equal to the hours in the current month, counted across those regions. The row also includes 30 GB-months of standard persistent disk and 1 GB of outbound data from North America to everywhere except China and Australia. GPUs and TPUs are billed even then. An e2-medium in "whatever region is closest" is outside that row on both the shape and, unless closest happens to be one of those three, the region.
If the 90 days pass, or the $300 is spent, and the billing account is still the trial account, Google closes it. Resources stop. Compute Engine data is marked for deletion. A 30-day grace period is the window where upgrading to a paid account can still recover them. Upgrading ends the trial, keeps whatever credit is left until the original 90 days are up, and bills usage past the credit and the free tier.
What did the 4 GB guest do with a 1024M heap?
Both boots used one disk. Ubuntu 24.04.5 LTS, kernel 6.8.0-147-generic, SwapTotal 0. Java was java-25-amazon-corretto-jdk version 1:25.0.5.0.10-1, the same Corretto 25.0.5 build 25.0.5+10-LTS as the Paper systemd unit. The jar was Paper 26.3 build 237, 26.3-237-main@7e88a0d, 55,268,778 bytes, sha256 57d8774be83dbe2be6a814e945f26a6b82339af9b1c82b768bbfdf4c23fda56e. The tutorial's jar is Mojang's. These tick times are Paper's. I passed --nogui. His command uses the bare word nogui.
qemu -m 4096 -smp 2 left MemTotal at 4,009,864 kB. I set eula=true. systemd-run started the JVM as root, and Paper printed its warning about an administrative user. The unit was:
sudo systemd-run --unit=paperheap --collect \
  -p CPUQuota=100% \
  -p WorkingDirectory=/opt/minecraft \
  /bin/bash -c 'exec /usr/lib/jvm/java-25-amazon-corretto/bin/java -Xms1024M -Xmx1024M -jar paper.jar --nogui < /opt/minecraft/in'
CPUQuotaPerSecUSec was 1s. The first start generated the world and logged Done (25.358s)!. The overworld spawn area took 8205 ms. DataConverter finished in 1,609.5 ms. server.properties came out with online-mode=true, white-list=true, view-distance=10, simulation-distance=10, server-port=25565, max-players=20.
On the first idle stretch, before any added load, ps RSS was 927,932 kB and MemAvailable was 2,711,832 kB. The 10 second median then was 0.2 ms, and TPS was 20.0.
I then force-loaded four chunks and filled them with hoppers, 4,096 and then 16,384, 20,480 in total. The 10 second window settled at 4.4 / 6.6 / 7.3 / 10.1 ms, TPS 20.0, process CPU 16%. I filled those blocks back to air. After that, spark's 10 second window was a median of 0.1 ms (min 0.1, 95th 0.2, max 0.3), TPS 20.0, process CPU 1%.
The load that moved the median was a datapack. version.json in the jar has data_major 121, so the pack format was 121. The tick function was the line scoreboard players add #i t 1 repeated 150,000 times, 4,500,000 bytes. A first try at 80,000 commands stopped with Command execution stopped due to limit (executed 65536 commands). I set the gamerule, then reloaded:
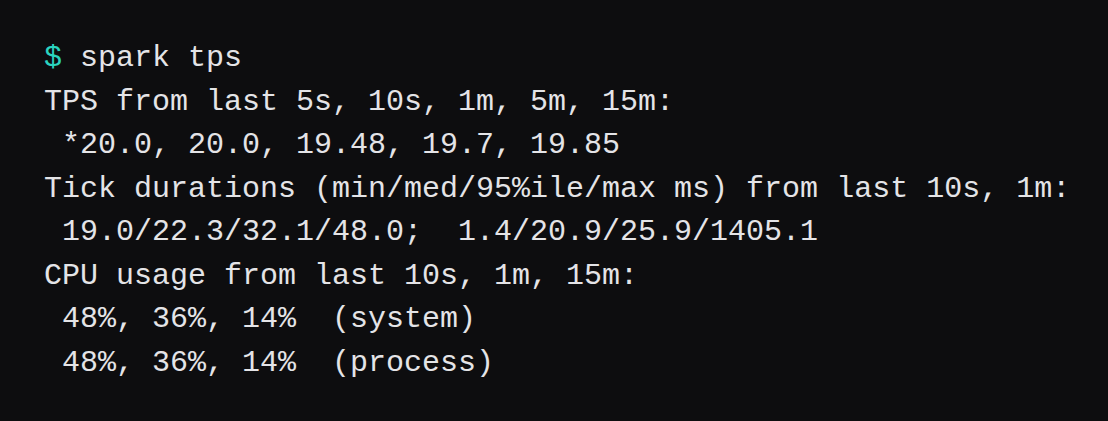
gamerule max_command_sequence_length 400000The 1 minute spark window still contained that reload (max 1405.1 ms). The 10 second window after it was the one I kept. TPS 20.0. Tick min 19.0 ms, median 22.3 ms, 95th 32.1 ms, max 48.0 ms. Process CPU 48%. The 10 second window just before that one had a median of 21.5 ms and a max of 50.1 ms. ps RSS at the later sample was 1,419,944 kB. MemAvailable was 2,195,052 kB. Across the whole life of that service, cpu.stat showed 454 throttled periods out of 5,688. The quota was binding on a process with more than one thread, and the server still finished ticks inside the 50 ms budget.
What did the 1 GB guest do with that heap?
Same disk, qemu -m 1024 -smp 2, MemTotal 984,196 kB, CPUQuota=25% (CPUQuotaPerSecUSec=250ms). Linux overcommitted the 1024M reservation, so the process got through bootstrap. DataConverter took 7,800.3 ms. It logged Loaded 1866 advancements. Then the kernel killed it:
Out of memory: Killed process 941 (java) total-vm:3681148kB, anon-rss:789080kB, file-rss:2932kB, shmem-rss:0kB, UID:0 pgtables:1836kB oom_score_adj:0systemd recorded Failed with result 'oom-kill', status 9/KILL, and 19.821 seconds of CPU time. There is no Done line for that process.

I moved the datapack aside and started -Xms512M -Xmx512M under the same 25% quota. That one logged Done (89.190s)!. The world was already generated, so the overworld spawn prep was 91 ms. This Done time is the restart of that world under the quota. The 10 second idle window was min 0.2 ms, median 0.3 ms, 95th 0.5 ms, max 9.2 ms, TPS 20.0, process CPU 10%. ps RSS was 702,916 kB. MemAvailable was 48,560 kB. cpu.stat at that sample had 985 throttled periods out of 1,238.
Putting the datapack back and running reload is where this guest stopped. Paper logged that the server had not responded for 10 seconds, then 15, then 20, then 26, with the server thread inside reloadResources. The kernel then killed java:
Out of memory: Killed process 1387 (java) total-vm:3208788kB, anon-rss:792272kB, file-rss:3116kB, shmem-rss:0kB, UID:0 pgtables:1924kB oom_score_adj:0systemd's line for that unit was 39.072 seconds of CPU time and result oom-kill. There is no spark sample of the 150,000-command tick on this guest. The 22.3 ms median is from the 4 GB shape.
What does the server list show?
Nobody joined. online-mode and white-list stayed as the jar wrote them. The tick function is load with no player attached. A friend walking around at view-distance=10 would be a different load, and this page has no number for that. I started the 512M heap again with the datapack set aside and sent a status handshake to 127.0.0.1:25565 on the guest, protocol 777, next state 1. It returned:
{"description":"A Minecraft Server","players":{"max":20,"online":0},"version":{"name":"Paper 26.3","protocol":777},"enforcesSecureChat":true}Online 0, max 20, description matching motd. The handshake stops at the server list, short of online-mode and the whitelist. 25565 stayed on the guest. The query used 127.0.0.1. His HTTP and HTTPS checkboxes are unused by this game.

A panel in front of the same jar is a separate install. Wings on Paper 26.3 and ordering the game from a host are that path. The tick numbers on this page are the qemu guests above.
What does Iowa list for 90 days of the tutorial machine?
On the general-purpose price page, region Iowa (us-central1), default column, the shared-core rows were:
| Machine | vCPUs and memory on the page | Hourly, default | Monthly, default |
|---|---|---|---|
e2-micro | 2 vCPUs, 1 GiB | $0.008376428 | $6.11479244 |
e2-medium | 2 vCPUs, 4 GiB | $0.03350571 | $24.4591683 |
The monthly column is the page's own column. I used the hourly cell for a 90-day run, because 90 days is 2,160 hours and the page's month is a different length. 2160 * 0.03350571 is $72.3723336. That is the VM line only. Disk and egress are separate prices. I have no per-GB figure for either. The free tier already includes 30 GB-months of standard persistent disk and 1 GB of North American egress, so a small boot disk can sit inside the disk allowance, and a server with players can leave the 1 GB egress allowance. This run had no players, so it says nothing about that byte count.
$72.3723336 sits well under the $300 credit. A single e2-medium, before disk and egress, leaves most of that credit unspent at 90 days. The trial still ends then if the account is still a trial account. The credit can still be sitting there when the VM is stopped.
The list price of an e2-micro for those same 2,160 hours is 2160 * 0.008376428, which is $18.09308448. Always Free covers one e2-micro for the hours in the month, in the three US regions, so that list price is what applies once the use is outside the free tier. The machine that fits the free row is the 1 GB shape. On that shape the tutorial's 1024M heap was the process the kernel killed.
FAQ
Does the $300 trial cover an e2-medium for the whole 90 days?
At the Iowa hourly cell, 2,160 hours of e2-medium is $72.3723336 before disk and egress. The credit is $300. The VM line alone leaves that credit in place. The account still closes at 90 days if it is still a trial account.
What happens to the world when the trial ends?
On a trial account left as a trial account, Google stops the resources and marks Compute Engine data for deletion. The grace period on the free trial page is 30 days, and an upgrade during that window is how a stopped VM can be recovered. Upgrading earlier keeps the VM running, keeps leftover credit until the original 90 days end, and starts billing anything outside the credit and the free tier.
Why did 1024M die on a 1 GB guest when it started on the 4 GB guest?
MemTotal on qemu -m 1024 was 984,196 kB. The heap flag asks for 1024M. The kernel allowed the virtual reservation, the process reached Loaded 1866 advancements, and the OOM killer then reported anon-rss 789,080 kB and total-vm 3,681,148 kB. The 512M heap is the one that printed Done on that guest.
Will an empty world lag on the free machine?
Idle, the 512M heap on the 1 GB guest held TPS 20.0 with a 10 second median of 0.3 ms. MemAvailable at that sample was 48,560 kB. There is no spark sample of that function on the 1 GB guest. The reload stalled, and the kernel killed the process at anon-rss 792,272 kB.
Can someone log in with the settings the jar wrote?
The server list can see it. Login still has online-mode=true and white-list=true, and this run added no names. The status payload's player count was 0.