
Two hundred clients sat on PgBouncer. SHOW POOLS kept the server side at 20. The same Postgres, asked for 120 connections with no pool in front, answered that the remaining slots were reserved for superusers.
The server is PostgreSQL 16.15 from Ubuntu 24.04, 16.15-0ubuntu0.24.04.1. PgBouncer is 1.22.0. Both ran in a systemd slice, db2g.slice, with MemoryMax=2147483648 and MemorySwapMax=0. That is a 2 GiB ceiling on the two processes. The machine under the slice has more RAM. During the 200-client run the slice's memory.current read 269,770,752 bytes, about 257 MiB.
shared_buffers is 512 MB, a quarter of that ceiling, and it stayed there. One number, then the measurements. max_connections is 100. superuser_reserved_connections is 3.
The two packages
apt-get install postgresql pgbouncerOn Ubuntu 24.04 that is PostgreSQL 16.15-0ubuntu0.24.04.1 and PgBouncer 1.22.0-1build4. The unit you limit is [email protected], plus pgbouncer.service. Both were placed in db2g.slice:
[Slice]
MemoryMax=2147483648
MemorySwapMax=0
systemctl daemon-reload and a restart of those two units is what moved the postmaster into the slice. ps had shown it in system-postgresql.slice until the drop-in named db2g.slice was on the template instance.
The pool file is /etc/pgbouncer/pgbouncer.ini. The keys that match this run:
[databases]
bench = host=127.0.0.1 port=5432 dbname=bench

[pgbouncer]
listen_addr = 127.0.0.1
listen_port = 6432
pool_mode = transaction
max_client_conn = 200
default_pool_size = 20
max_prepared_statements = 200
Postgres itself keeps shared_buffers = 512MB, max_connections = 100, and superuser_reserved_connections = 3. The app role connects to 127.0.0.1:6432. The server side of the pool is 127.0.0.1:5432, where the password is what Postgres expects.
Build the database, then the two shapes of run:
sudo -u postgres createdb bench
sudo -u postgres pgbench -i -s 10 bench
pgbench -h 127.0.0.1 -p 6432 \
  -c 20 -j 4 -T 60 bench
pgbench -h 127.0.0.1 -p 6432 -S \
  -c 200 -j 8 -T 20 bench
The first pgbench is the TPC-B minute, 20 clients, 4 threads, 60 seconds, simple protocol. The second is the select-only burst, 200 clients, 8 threads, 20 seconds. SHOW POOLS during that burst is the table with sv_active stuck at 20. Straight to port 5432, drop the -p 6432 and point at 5432. The 120-client attempt that Postgres refused was that direct port.
Twenty clients, direct and through the pool
The database is pgbench -i -s 10. The runs use pgbench's default simple protocol, 20 clients, 4 threads, 60 seconds. PgBouncer is in transaction mode, max_client_conn = 200, default_pool_size = 20. The app role connects to 127.0.0.1:6432. dropdb ran as the local postgres user, with the pool stopped, so a pool of idle server connections could not block the drop.
Three runs straight to port 5432:
| Run | Transactions | Average latency | Transactions per second |
|---|---|---|---|
| 1 | 103,018 | 11.637 ms | 1,718.72 |
| 2 | 105,899 | 11.321 ms | 1,766.70 |
| 3 | 99,357 | 12.066 ms | 1,657.56 |
Three runs through the pool:
| Run | Transactions | Average latency | Transactions per second |
|---|---|---|---|
| 1 | 106,897 | 11.217 ms | 1,782.99 |
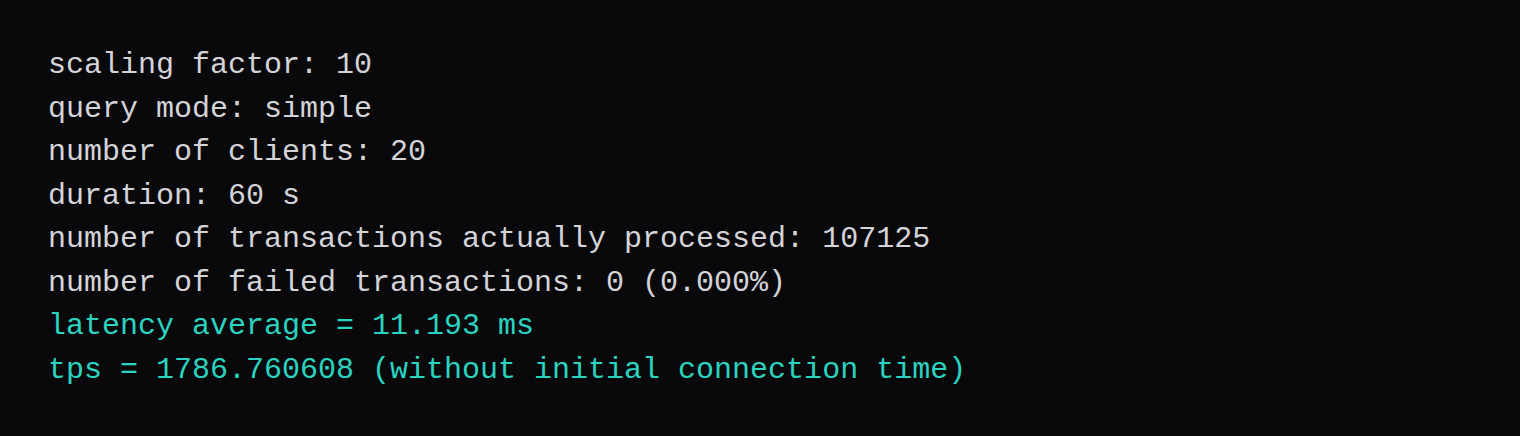
| 2 | 107,125 | 11.193 ms | 1,786.76 |
| 3 | 107,368 | 11.169 ms | 1,790.64 |
Every run reported number of failed transactions: 0. The transactions-per-second line is the one pgbench labels "without initial connection time." Initial connection time on these six was between 60 ms and 80 ms, once, at the start.
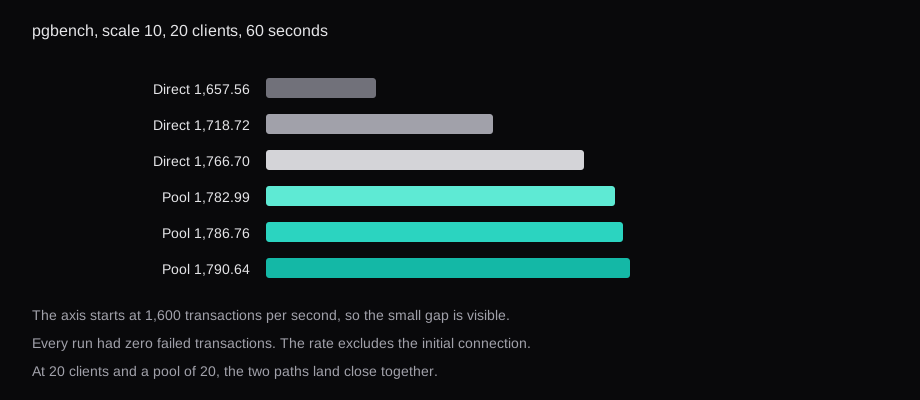
The median direct run is the first one, 1,718.72 per second, average latency 11.637 ms. The median pooled run is the second, 1,786.76 per second, average latency 11.193 ms. Average latency is the mean across transactions in that minute, not a percentile. A single slow transaction moves it less than it moves the max, which is why the MariaDB runs quoted a 95th percentile and these quote the average pgbench prints. At 20 clients and a pool of 20, every client can hold a server connection. The pool has nothing to queue. The rates land close together, which is what that setup should do.
Across those six minutes pg_stat_database moved by 15,829,995 buffer hits and 19,828 disk reads on bench. That is 99.87% of block reads served from the cache. The 512 MB setting was large enough for a scale-10 pgbench database. I did not try a second size.
Two hundred clients, twenty server connections
The interesting run is select-only, 200 clients, 8 threads, 20 seconds, through the pool. pgbench processed 469,981 transactions, zero failures, average latency 8.247 ms, 24,252.65 per second. Initial connection time was 636 ms, and the rate above leaves that out. The rate is higher than the TPC-B runs because the statement is a single select.
While it ran, three SHOW POOLS snapshots:
cl_active  cl_waiting  sv_active  maxwait_us  pool_mode
55         145         20         5495        transaction
51         149         20         6375        transaction
56         144         20         7063        transaction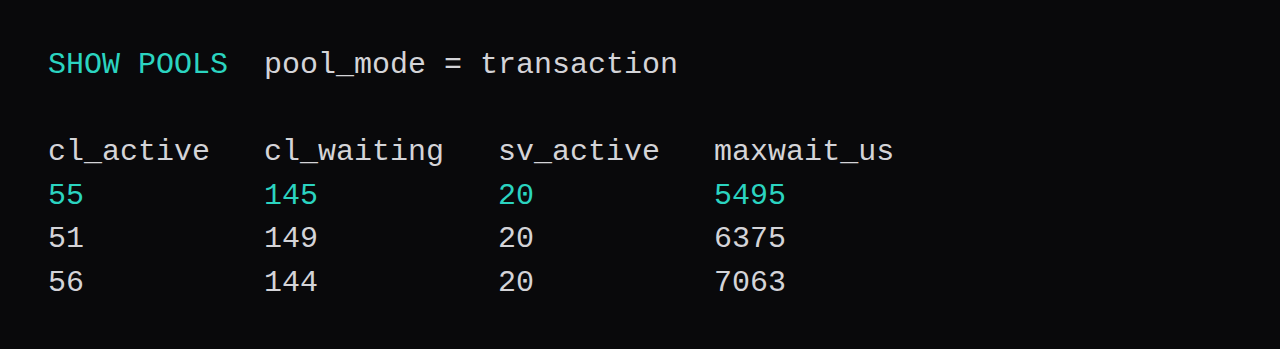
cl_active plus cl_waiting is 200 on each line. sv_active is 20, and sv_idle was 0. Postgres was busy with the pool's 20, and the other 144 to 149 clients waited inside PgBouncer. The longest maxwait_us in the three samples is 7,063, which is 7.1 ms.
A direct attempt with 120 clients hit the ceiling the pool is for:
FATAL:  remaining connection slots are reserved for roles with the SUPERUSER attribute
pgbench: error: could not create connection for client 71
max_connections is 100 and 3 of those are reserved. The bench role is not a superuser. Past the slots Postgres will give it, new connections are refused. The pool's job is to keep the app's worker count on the client side of that line.
One earlier attempt at the pool used a Unix socket. Postgres then asked for a peer login, and the bench role is not an OS user of the same name. The working line points PgBouncer at 127.0.0.1:5432, where the password is what the server expects.
A dump you restore
pg_dump -Fc of bench took 0.918 seconds and wrote 5,552,928 bytes. PgBouncer was stopped, backends were terminated, the database was dropped and created again, and pg_restore finished in 1.574 seconds.
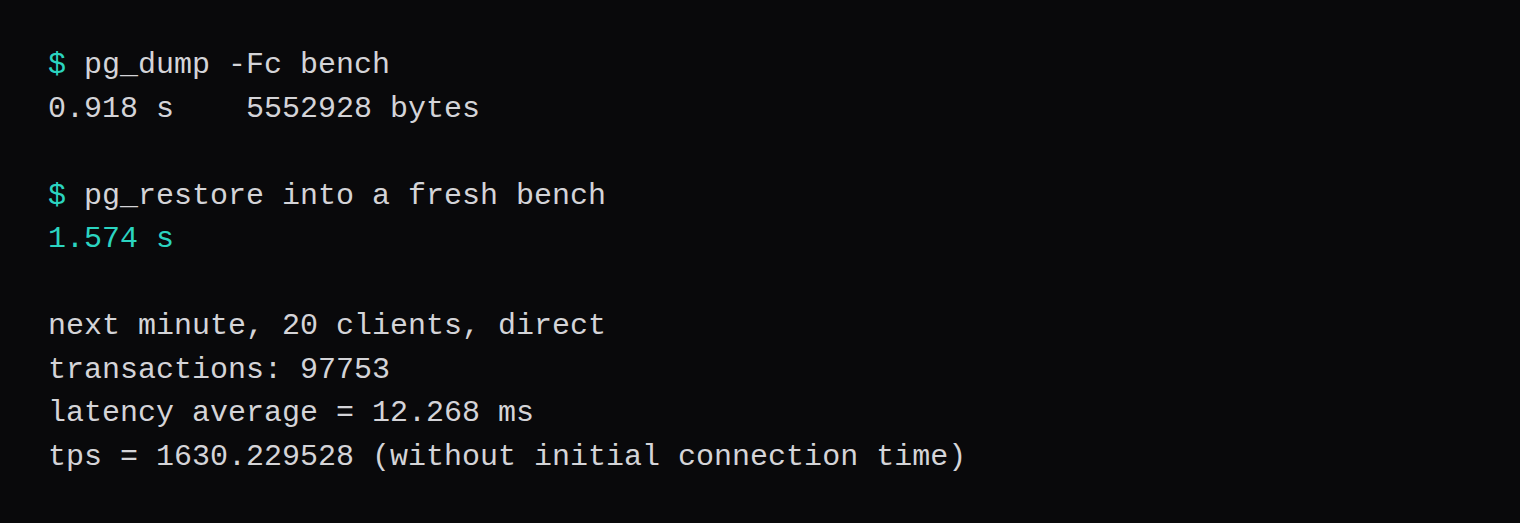
The minute after that restore, 20 clients, direct: 97,753 transactions, average latency 12.268 ms, 1,630.23 per second, zero failures. Slower than the median direct run from before the drop. The cache had just been rebuilt by the restore, and this is one run.
The first drop failed. PgBouncer still held its server connections, and dropdb returned database "bench" is being accessed by other users with 20 other sessions. Those 20 are default_pool_size. Stopping the pool, then terminating anything left in pg_stat_activity for that database, is what let the drop proceed.
Transaction mode returns the server connection to the pool at the end of the transaction. SET, a temporary table, and a prepared statement made in one transaction are gone on the next one, because the next transaction may land on a different server connection. These runs used the simple protocol, so prepared statements were not in the measurement. max_prepared_statements was set to 200 on the pool and then left unused. An app that prepares statements on every request needs that setting, or it needs session mode, and session mode is the mode that pins a server connection for the life of the client. That would erase the picture above, where 200 clients share 20 servers.
Do you put PgBouncer in front of one connection?
Twenty clients against a pool of 20 changed the rate from 1,718.72 to 1,786.76 per second, median to median. That is the same workload. The pool earns its place when the app opens more connections than Postgres will accept for a normal role. Here that was 100 slots, 3 of them reserved, and client 71 was the one pgbench reported when the rest were refused.
The package unit is [email protected], not postgresql.service. A memory limit on the short name left the process in the slice the package had started. ps showed the postmaster in system-postgresql.slice until the drop-in was on the template instance and the service was restarted. After that, /proc/<pid>/cgroup read db2g.slice, and memory.current on that slice is the number quoted above. Shared memory makes a per-process RSS misleading here: each backend's RSS includes a view of shared_buffers, so adding those RSS figures over-counts the same pages. The slice counter is the one that matches the cap.
What did the 2 GiB cap actually hold?
shared_buffers at 512 MB did not fill the slice. The high reading during the 200-client select was 269,770,752 bytes. A scale-10 database and 20 server connections fit. The cap is still the ceiling to set on the service. A shared_buffers copied from a larger machine is what would test it. The hit rate above is why this one stayed at 512 MB.