
The slow log had three statements. All three were the same join of sbtest1 to itself. The setting that got the process killed was a buffer pool of 24G, and that line was not in the log.
This is MariaDB 10.11.14-MariaDB-0ubuntu0.24.04.1, the mariadb-server package on Ubuntu 24.04. The archive package is 1:10.11.14-0ubuntu0.24.04.1.
apt-get install mariadb-server
systemctl enable --now mariadb
The service sat under MemoryMax=2147483648 and MemorySwapMax=0. That is a 2 GiB ceiling on the service. The machine underneath has more RAM, and the host has no swap. The kill, when it came, named the cgroup. A drop-in on mariadb.service is where that ceiling was set, then systemctl daemon-reload and a restart.
What the package starts with
A fresh start reported innodb_buffer_pool_size of 134,217,728 bytes, which is 128 MiB. max_connections was 151. bind_address was 127.0.0.1. The slow log was off, and long_query_time was 10 seconds.
sysbench 1.0.20 built two tables, sbtest1 and sbtest2, 100,000 rows each. information_schema put each one at 21.5 MB of data and 3.0 MB of index. Call it 49 MB for both.
One oltp_read_write run, 4 threads, 60 seconds, against that server:
transactions:                        46237  (770.55 per sec.)
Latency (ms):
         min:                                    3.30
         avg:                                    5.19
         max:                                  115.93
         95th percentile:                        9.73
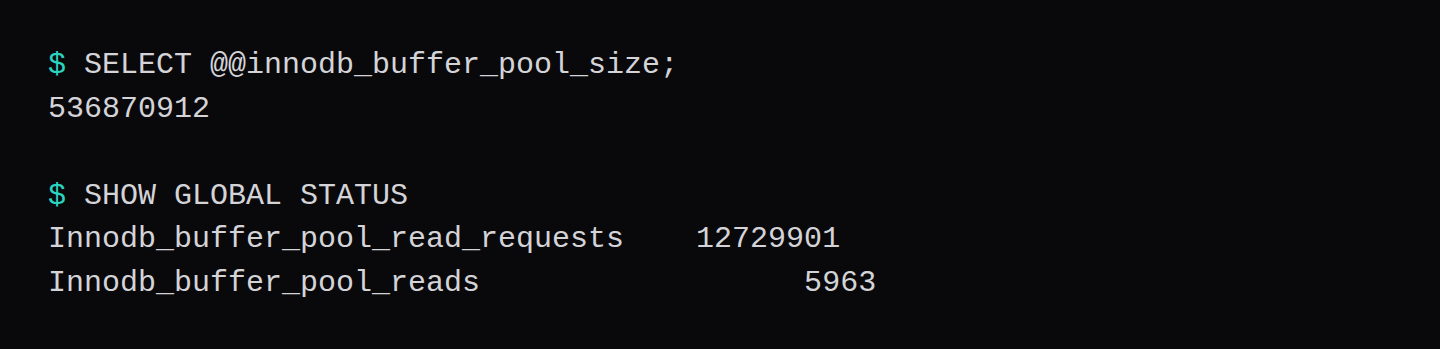
After that run, Innodb_buffer_pool_read_requests was 6,820,942 and Innodb_buffer_pool_reads was 165. Those counters cover the life of the process, including the load of the two tables. FLUSH STATUS does not clear them. I checked later: the reads counter was 5,968, I flushed, and it was still 5,968. So the 165 is "since start," and it is still a small number next to 6.8 million requests. A 49 MB working set fits in a 128 MiB pool.
The 24G pool under a 2 GiB cap
The next file was one line.
[mysqld]
innodb_buffer_pool_size = 24G
MariaDB started. The error log said innodb_buffer_pool_size_max=24576m, innodb_buffer_pool_size=24576m, then Completed initialization of buffer pool, then ready for connections. It did not refuse the number.
Right after a 15 second sysbench, the process RSS was 638,096 KiB and the virtual size was about 26 GB. The cgroup's MemoryCurrent was 641,572,864 bytes. The pool was mapped. The pages were not resident, because the working set was still those two tables.
Then a table called fat, one LONGBLOB column, and inserts of REPEAT('x', 1048576). Every 50 rows the cgroup grew by roughly 50 MB. At 1,400 rows MemoryCurrent was 2,142,969,856. The next inserts died at row 1,405 with ERROR 2013 (HY000): Lost connection to server.

systemd recorded three lines: a process of the unit had been killed by the OOM killer, the main process exited code=killed, status=9/KILL, and the unit failed with result oom-kill. The kernel constraint was CONSTRAINT_MEMCG, the cgroup was /system.slice/mariadb.service, and the killed process was mariadbd with total-vm:27928912kB and anon-rss:2078516kB.
A 128 MiB pool would have evicted pages as those blobs landed. A 24G pool held them until the cgroup ran out. The server had already said it was ready. The failure showed up when the table grew.
Three statements over one second
With the pool back under control, the slow log went on at long_query_time = 1 and a file under /var/log/mysql/. The two settings:
[mysqld]
slow_query_log = 1
long_query_time = 1
systemctl restart mariadb is what made the server reread them. The sysbench statements from the first run never reached that bar. The slowest transaction in that 60 seconds was 115.93 ms. sysbench was 1.0.20. It built sbtest1 and sbtest2 at 100,000 rows each, then ran oltp_read_write with 4 threads for 60 seconds. The three joins below were separate statements, written so the log would have something over one second to rank.
The three lines that did cross a second were written on purpose, so the log would have something to rank:
# Query_time: 1.702351  Lock_time: 0.000201  Rows_sent: 1  Rows_examined: 7999
SELECT COUNT(*) FROM sbtest1 a, sbtest1 b WHERE a.id < 8000 AND b.id < 8000;

# Query_time: 2.319148  Lock_time: 0.000057  Rows_sent: 1  Rows_examined: 8999
SELECT COUNT(*) FROM sbtest1 a, sbtest1 b WHERE a.id < 9000 AND b.id < 9000;

# Query_time: 2.810043  Lock_time: 0.000052  Rows_sent: 1  Rows_examined: 9999
SELECT COUNT(*) FROM sbtest1 a, sbtest1 b WHERE a.id < 10000 AND b.id < 10000;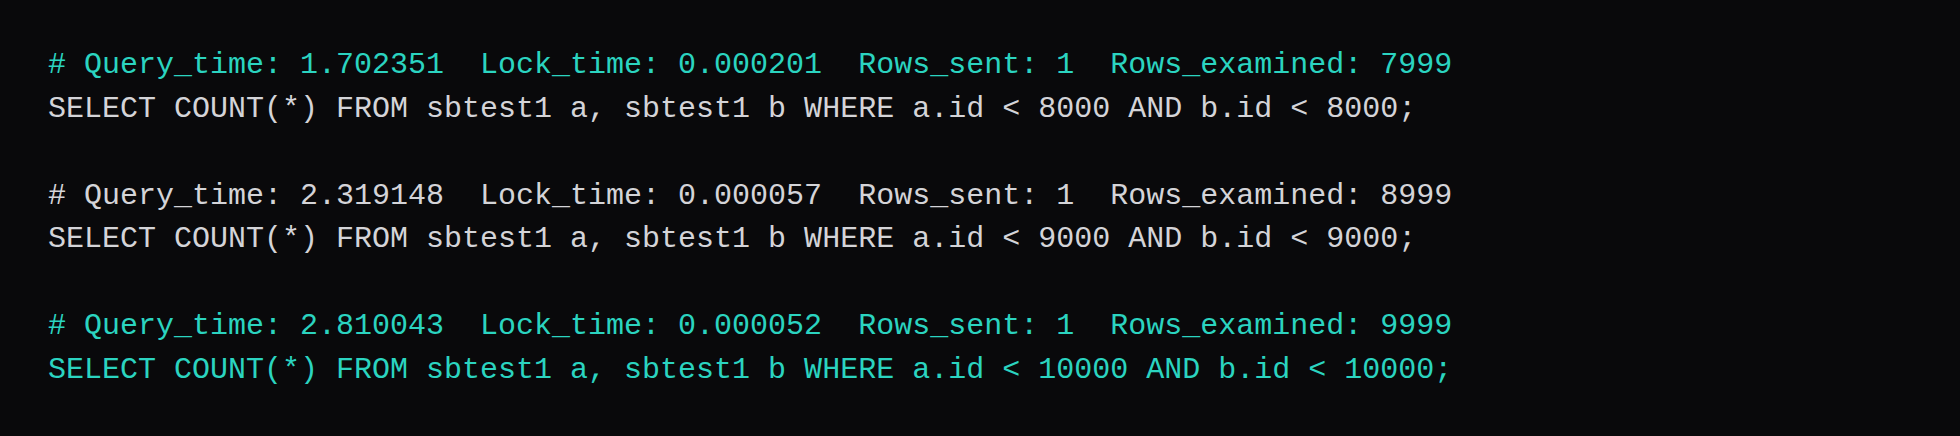
EXPLAIN on the 8,000 cutoff says both sides are a range on the primary key, and the second side uses a join buffer, flat, BNL join. The index is already there. The time is the nested loop that pairs the two ranges. Rows examined in the log, 7,999 and then 8,999 and 9,999, is what MariaDB wrote down. The client wall times were 1.70, 2.32, and 2.81 seconds, in the same order.
That list is the tuning agenda. The statement is the join. A larger buffer pool does not change the number of pairs.
A 512 MiB pool, and the hit rate
512 MiB is a quarter of the 2 GiB cap. I set that, restarted, and ran the same 60 second sysbench twice.
The minute that started on an empty pool did 49,968 transactions, 832.74 per second. Average latency 4.80 ms, 95th percentile 5.99 ms, max 364.86 ms. The max is the cold start showing up in one transaction.
The next minute, same pool, tables already touched: 55,743 transactions, 928.97 per second. Average 4.30 ms, 95th percentile 6.09 ms, max 71.64 ms.
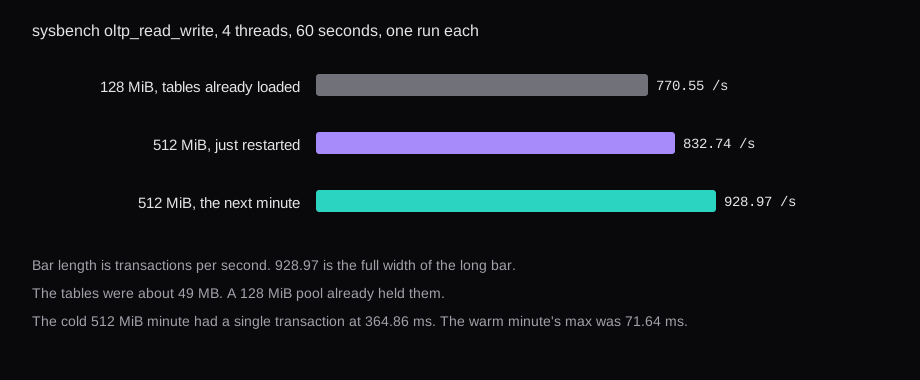
Between the end of the first 512 MiB minute and the end of the second, Innodb_buffer_pool_read_requests rose by 6,683,259 and Innodb_buffer_pool_reads rose by 56. That is one disk read per about 119,000 requests in that minute. The 128 MiB process, over its whole life, had 165 disk reads against 6,820,942 requests. Both pools were holding the 49 MB.
MemoryCurrent with the 512 MiB setting, after that work, was 198,373,376 bytes. The process RSS was 217,216 KiB. Resident memory stayed under the configured pool, because the working set is smaller than the setting.
max_connections stayed 151. Nothing in the slow log or the status named it.
The hit rate is the two counters divided. (read_requests - reads) / read_requests. On the 128 MiB process that is (6820942 - 165) / 6820942. On the warm 512 MiB minute the counters moved by 6,683,259 requests and 56 reads, so the same division on the delta is the number for that minute. FLUSH STATUS left Innodb_buffer_pool_reads unchanged, which is why the delta is the honest window and the raw counter is "since the process started."
A slow-log line is four facts and a statement. Query_time is how long it ran. Lock_time is how long it waited on a lock, and here that was under a millisecond, so the time is the query itself. Rows_examined is what MariaDB counted. Rows_sent was 1, because the statement is a COUNT(*). The statement under those headers is the thing you change. For this join the plan is already an index range on both sides, plus a join buffer. The pairs are the cost. Rewriting the statement, or not running it, is the change the log is pointing at. The buffer pool line is a separate decision, and you make it when the reads counter is climbing during the workload you care about.
The 24G file is what a copied my.cnf looks like when the number came from a bigger machine. MariaDB 10.11 accepted it, mapped it, and stayed near 638 MB RSS while the working set was 49 MB. The kill arrived when the blob table gave the pool something large to hold. anon-rss:2078516kB is the cgroup's 2 GiB, reached from inside. A pool sized under the cap evicts. A pool sized far over the cap holds pages until the cgroup kills the process.
Is the Ubuntu package Oracle MySQL?
The binary on this machine is 10.11.14-MariaDB-0ubuntu0.24.04.1. mariadb --version prints that string. Oracle MySQL is a different package, and it is not what apt install mariadb-server put here.
Do you raise the pool because the cap is 2 GiB?
You raise it when Innodb_buffer_pool_reads is moving during the workload you care about. Here the tables were 49 MB, the 128 MiB pool was already serving them, and the statements over one second were a join. The 24G line is the one that mapped a huge pool and then died at anon-rss:2078516kB once a real table filled it.