
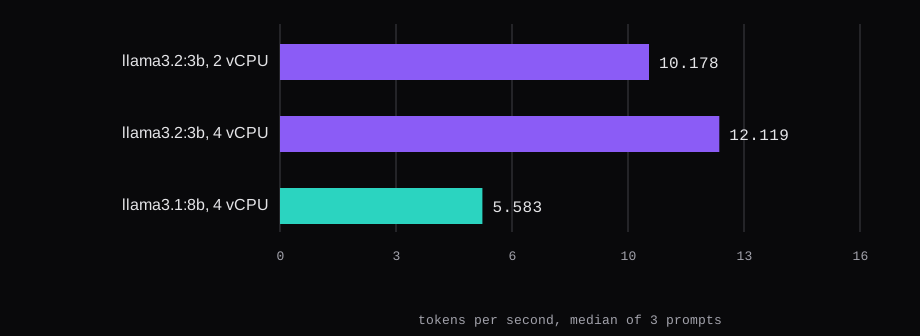
Llama 3.2 3B wrote at a median 10.178 tokens per second on 2 vCPU, and 12.119 on 4 vCPU of the same CPU. Llama 3.1 8B was killed on the 4 GB guest. On the 8 GB guest it stayed loaded, ollama ps reported 5.6 GB, and the median of three prompts was 5.583 tokens per second.
Those are generation rates: output tokens divided by the time spent writing them. Reading the prompt is a separate clock. A 1,957 token prompt took 51.787 seconds on 2 threads and 40.395 seconds on 4 threads with the 3B. The same file, 1,942 tokens on the 8B tokenizer, took 141.427 seconds on 4 threads.
The tag, the digest, and the quant are pinned. llama3.2:3b is a80c4f17acd5, 2.0 GB, Q4_K_M, 3.2B parameters. llama3.1:8b is 46e0c10c039e, 4.9 GB, Q4_K_M, 8.0B parameters. Ollama is ollama/ollama:0.40.13, image digest sha256:b2f0122c476bc9fe7ce679d8bb4bd555351e25e2554eefb156f61cb0a89cf429.
| Guest | Model | Median tok/s | The three rates | Prompt eval |
|---|---|---|---|---|
| 2 vCPU, MemTotal 3,915.9 MiB | llama3.2:3b | 10.178 | 11.224, 10.178, 9.376 | 51.787 s, 1,957 tokens |
| 4 vCPU, MemTotal 7,941.2 MiB | llama3.2:3b | 12.119 | 15.001, 12.119, 11.092 | 40.395 s, 1,957 tokens |
| 4 vCPU, MemTotal 7,941.2 MiB | llama3.1:8b | 5.583 | 7.209, 5.583, 4.604 | 141.427 s, 1,942 tokens |
| 2 vCPU, MemTotal 3,915.9 MiB | llama3.1:8b | killed |
The first prompt in each live set stopped before the cap: 116, 116, and 99 output tokens. The other two hit num_predict 128. The median is the middle of the three rates, and on every set the third prompt was the slowest.
How do you measure Ollama tokens per second on CPU?
The guests were Ubuntu 24.04.5 LTS, kernel 6.8.0-147-generic, hostname paas, swap off. Docker was 29.1.3. The CPU string from the guest was 11th Gen Intel(R) Core(TM) i7-1185G7E @ 2.80GHz, because qemu was started with -cpu host. One guest was -m 4096 -smp 2. The other was the same disk booted with -m 8192 -smp 4. free -m printed 3915 and 7941. MemTotal was 4,009,864 kB and 8,131,776 kB.
Three other qemu guests were running on that host for the whole set. The rates include that contention. Ordering a VM is the virtual machines guide. A plan that pins cores is the dedicated CPU guide. These two guests are the lab host.
The daemon was published on localhost only:
docker run -d --name ollama --restart unless-stopped \
  -v ollama:/root/.ollama \
  -p 127.0.0.1:11434:11434 \
  -e OLLAMA_KEEP_ALIVE=-1 \
  ollama/ollama:0.40.13
ss showed 127.0.0.1:11434. The Ollama FAQ says "Ollama binds 127.0.0.1 port 11434 by default." The same page says "By default models are kept in memory for 5 minutes before being unloaded." OLLAMA_KEEP_ALIVE=-1 and "keep_alive": -1 on each request keep the weights resident. After a load, ollama ps showed Forever in the UNTIL column.
num_thread was set to the guest's vCPU count, 2 or 4. num_ctx was 4096. Temperature was 0. The three prompts:
Explain what a VPS is. Use short sentences.
Give the commands to show disk space, memory, and listening ports on Linux.
Explain how a recursive DNS resolver turns a name into an address.
The call that produced a row:
curl -s http://127.0.0.1:11434/api/generate \
  -d '{"model":"llama3.2:3b","prompt":"Explain what a VPS is. Use short sentences.","stream":false,"keep_alive":-1,"options":{"num_thread":2,"num_predict":128,"num_ctx":4096,"temperature":0}}'
The rate in the table is eval_count / (eval_duration / 1e9). eval_duration is nanoseconds. Prompt seconds are prompt_eval_duration / 1e9.
At num_ctx 2048 the runner truncated a longer prompt. The log line was truncating input prompt, limit 1026, prompt 8765. The source of that limit, in Ollama 0.40.13, keeps 4 tokens and then frees about half of the remaining context, so a 2048 context accepts about 1,026 prompt tokens and a 4096 context accepts 2,050. The prompt used here fits under 2,050. It is 84 short sentences, 7,717 characters. llama3.2 counted 1,957 tokens. llama3.1 counted 1,942. A repeat of the 1,957 token prompt, while the model was still loaded, came back in 0.148 seconds. That is the prompt cache. The table uses the run taken after ollama stop, with an empty cache. On that 2 vCPU run, load_duration was 3.099 seconds and sits outside the 51.787.
How much RAM does a 3B or 8B model use on the VPS?
On the 2 vCPU guest, before any model was pulled, the container was warmed with ollama --version, left alone for 10 minutes, then read 20 times. The gap was 31.1 seconds, a 30 second sleep plus about a second to read memory.current, docker stats, and PSS. The shape matches the idle window in What fits on a 2 GB VPS.
All 20 readings of memory.current were 136,871,936 bytes, 130.5 MiB. PSS was 36.3 MiB on every reading. docker stats was 128.4 MiB. MemAvailable had a median of 3,387.5 MiB. SwapTotal was 0. MemTotal was 3,915.9 MiB, so the guest as a whole had about 528 MiB unavailable while the container sat at 130.5.
The 3B was then loaded and left for 10 minutes. Twenty more readings: median 3,322.5 MiB, minimum 3,322.4, maximum 3,331.7. PSS median 2,781.9 MiB. docker stats 2.826 GiB. ollama ps said 2.6 GB, 100% CPU, context 4096. MemAvailable median 702.8 MiB.
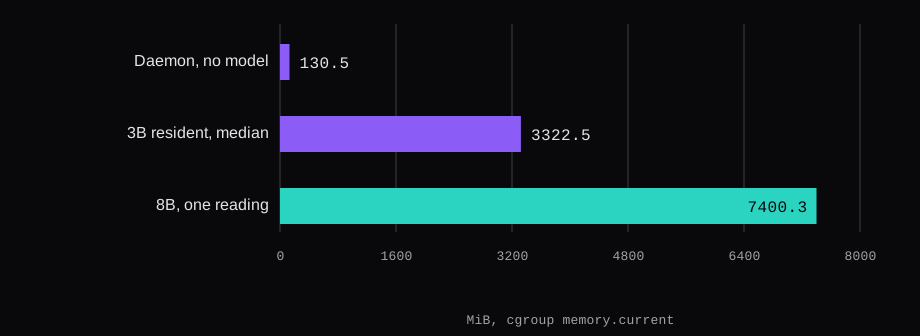
The 4 vCPU guest already had both blobs on disk, so its daemon-idle window is a different boot. Right after the 3B long prompt there, docker stats read 2.625 GiB and memory.current read 4,616.9 MiB. That cgroup number is higher than the settled 3,322.5 because the weights had just been read into the cache. ollama ps still said 2.6 GB.
The 8B reading, after its three prompts and the long prompt, was memory.current 7,400.3 MiB, docker stats 5.405 GiB, ollama ps 5.6 GB, MemAvailable 2,001.5 MiB, on MemTotal 7,941.2 MiB.
Why did the 8B get killed on 4 GB?
The 4.9 GB file pulled. The load request returned HTTP 500: llama-server process has terminated: signal: killed. The kernel log shows llama-server invoking the OOM killer, then Out of memory: Killed process with anon-rss 3,657,248 kB and total-vm 5,380,100 kB. A few seconds earlier the runner had printed a fit of 2,121 MiB against 3,915 MiB of host memory, and the line that it would leave 1,794 MiB free, above a 1,024 MiB floor, so "no changes needed." The process grew past that projection and died.
The first load on the 8 GB guest died the same way, at anon-rss 5,162,284 kB. The 3B had been used earlier in that boot, and both files were in the page cache. Stopping the 3B and dropping the page cache (echo 3 > /proc/sys/vm/drop_caches) let the same request load. ollama ps then showed 5.6 GB, 100% CPU, context 4096. A fresh 8 GB boot that has only the 8B to read can clear that hurdle on the first try. This boot needed the cache drop.
A 14B Q4 on the Ollama library, qwen2.5:14b, digest 7cdf5a0187d5, is a 9.0 GB file, 14.8B parameters, Q4_K_M. This bench left that tag alone. The 8B was already 5.6 GB inside a guest with 7,941 MiB MemTotal.
How long is prompt eval for about 2,000 tokens?
Generation on the 3B moved from 10.178 to 12.119 when the thread count went from 2 to 4, which is 1.19 times. Prompt eval on the same file moved from 51.787 seconds to 40.395 seconds. That is 37.79 prompt tokens per second against 48.45, or 1.28 times. Four threads bought a little more on the prompt than on the writing, and both gains are small on this CPU.
The runner log for the second 8B prompt, the one that ran the full 128 tokens:
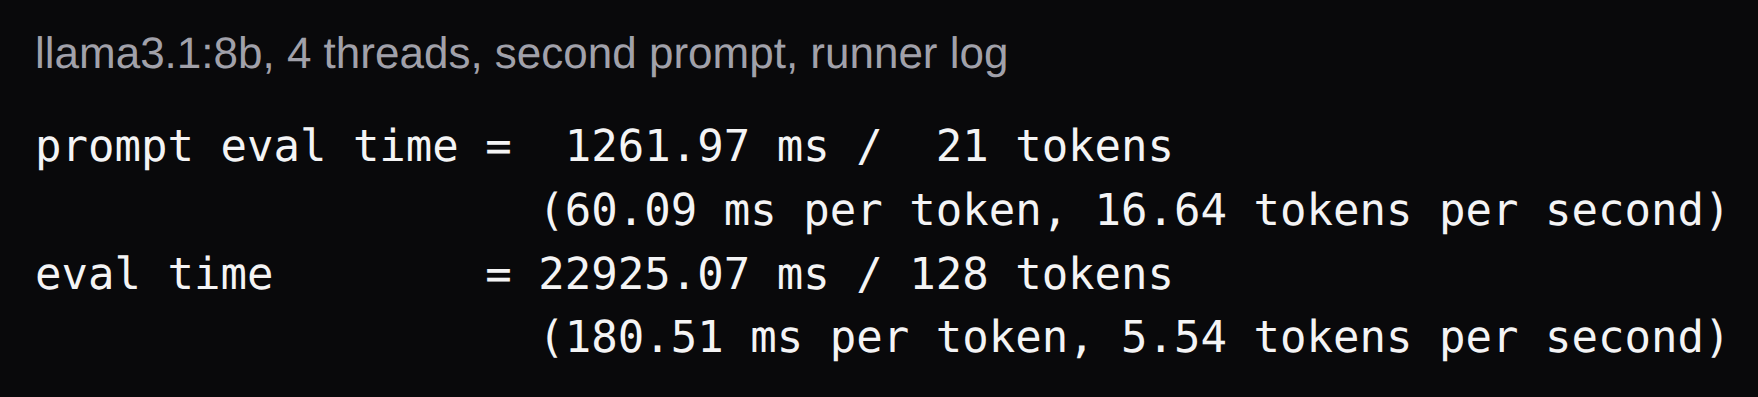
The API and the runner disagree by a handful of tokens on the same call. The long 8B prompt is the same split: the API says 1,942 tokens in 141.427 seconds, and the runner says 1,937 tokens in 141,426.84 ms, 13.70 tokens per second. The table uses the API fields.
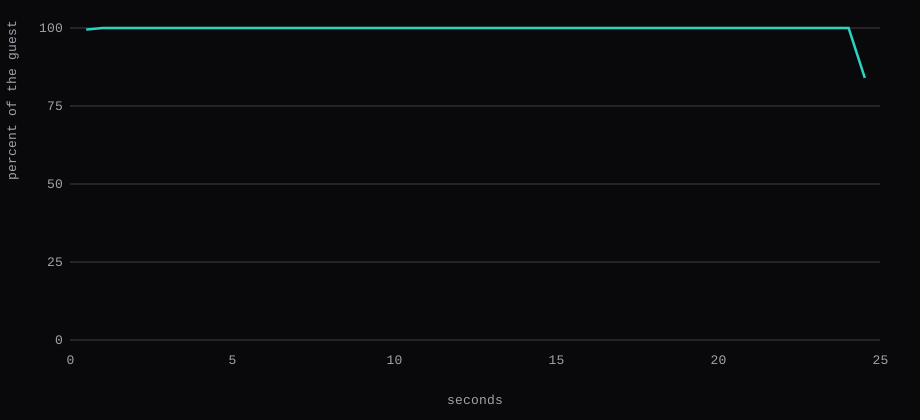
During that second 8B prompt the guest's own /proc/stat was sampled twice a second. Forty-eight of the 49 samples were at or above 99.5 percent. The last one, as the call ended, was 84. One hundred percent here means all 4 of the guest's threads. The host has 8.
What have other CPU VPS tests reported?
Two published benches are worth putting next to this one, in their own columns. The cells above are this lab. The cells here are theirs.
Nocthost measured Ollama on three Hetzner Cloud servers, default 4-bit models, median of three runs. Llama 3.2 3B: 4.3 tok/s on 2 shared vCPU and 4 GB, 7.1 on 4 shared vCPU and 8 GB, 16.3 on 4 dedicated vCPU and 16 GB. Llama 3.1 8B: their 4 GB cell is "does not fit", then 3.6 and 7.9. They wrote that going from 2 to 4 shared vCPUs gave about 1.6x, and that the dedicated box was about twice the 4 shared box, on a newer CPU, so the gap is the plan you are offered and also the processor. A 720 token prompt took them about 40 seconds on the smallest server with a 3B, and about 45 seconds with an 8B on dedicated cores.
FFxF used Ollama 0.40.3, an Intel Xeon Gold 6252, Ubuntu 24.04, temperature 0, 128 tokens, average of two measured requests after a warmup. Their Starter is 2 vCPU and 4 GB, Pro is 4 vCPU and 8 GB, Scale is 8 vCPU and 16 GB. llama3.2:3b generation was 6.6, 9.8, and 13.4 tok/s. They wrote that 2 to 4 vCPU speeds generation by 1.5 to 1.8 times, and that 4 to 8 vCPU adds 13 percent on the smallest models and 34 to 60 percent on the 3B to 8B ones. Their sentence on a long input: "Asking an 8B model on the Pro to summarise a 2,000-token document means about 85 seconds before the first word of the answer." The 8B prompt on this i7 took 141.427 seconds for 1,942 tokens.
They also put ordinary reading near 5 tokens per second, and they call a rate above 10 faster than reading. On that scale the 3B medians here, 10.178 and 12.119, sit on that line, and the 8B median of 5.583 sits on the slower side of it. The long prompt is the part you wait through either way: under a second for the 40 token questions, and 40 to 141 seconds once the input is around 2,000 tokens.
The dedicated CPU page describes pinned cores, four plan categories, and codes such as DC-CPU-8C-8G-320. A 4 vCPU, 16 GB row with a CPU name is absent from that page, so the table has a lab column and stops there.