
Minecraft runs twenty ticks a second. That is a 50 ms budget per tick. If the server thread finishes its work early, it parks for the rest of the budget. If the work overruns 50 ms, TPS drops below 20 and players see rubber-banding, delayed block breaks, and animals that stutter.
Ping is a different clock. It is the path from the client to the host. A friend on a bad route can feel lag while /spark tps still prints 20.0. Extra RAM leaves that path and that tick alone.
This lab booted Paper 26.3-242-fd28d65 (Minecraft 26.3) with the spark profiler Paper already bundles, on an Ubuntu 24.04 guest (4 vCPU, 3.8 GiB RAM, CPU model 11th Gen Intel i7-1185G7E @ 2.80GHz, Java 25.0.5 Temurin). Heap was MEMORY=2G. The world was flat creative, view-distance=10, simulation-distance=8, zero players. The numbers below are that box. Your MSPT will move with the chip, the world, and the plugin list.
| Symptom | Usually | First check |
|---|---|---|
| Rubber-band, delayed breaks, mobs freeze | Server thread over budget | /spark tps, then a short /spark profiler |
| Hitreg feels soft, chat arrives late, TPS still 20 | Network / route | Client ping, region of the host |
| Panel CPU high, spark wait share still huge | Noisy neighbour or steal | Host CPU graph + spark together (game server CPUs) |
| Heap climbs, GC pauses spike MSPT max | Memory pressure | /spark gc, then heap size (free trial lag) |
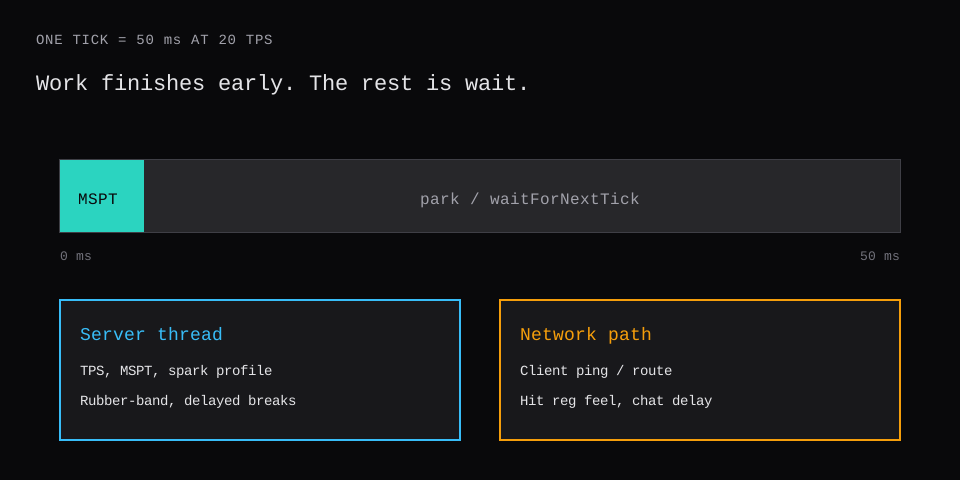
What do /spark tps and MSPT mean?
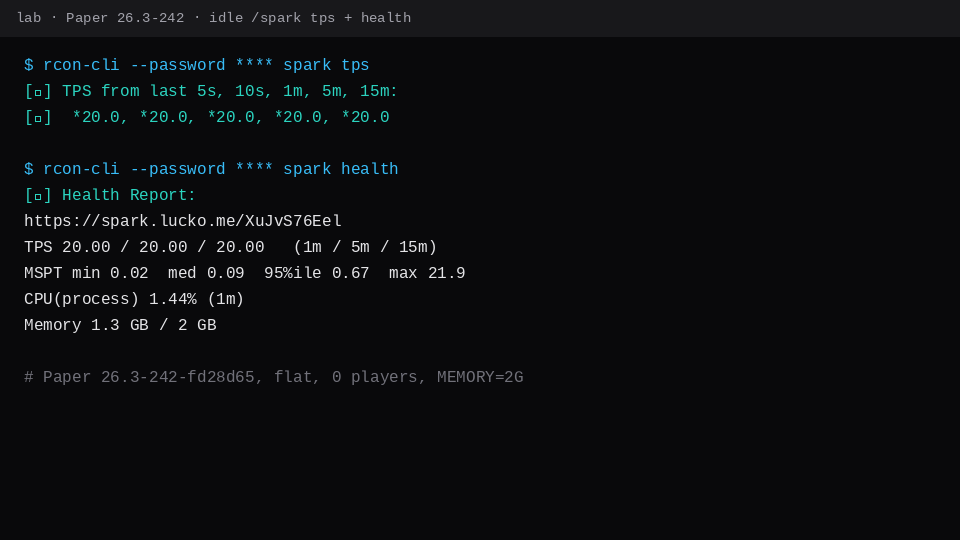
Paper logs that it bundles spark on boot. On this guest:
[spark] This server bundles the spark profiler. For more information please visit https://docs.papermc.io/paper/profilingFrom the console (or the panel console):
/spark tps
/spark health
/spark profiler start
/spark profiler stop
/spark tickmonitor --threshold-tick 50
/spark tps prints TPS over 5s, 10s, 1m, 5m, 15m, plus tick durations. /spark health uploads a shareable report. /spark profiler start then stop uploads a tree of where the server thread spent time. Docs often profile for minutes; this lab used short windows so the links stay tied to a known fixture.
Idle health report: spark.lucko.me/XuJvS76Eel.
| Window | TPS (1m / 5m / 15m) | MSPT min / med / 95%ile / max | CPU (process, 1m) | Memory (process) |
|---|---|---|---|---|
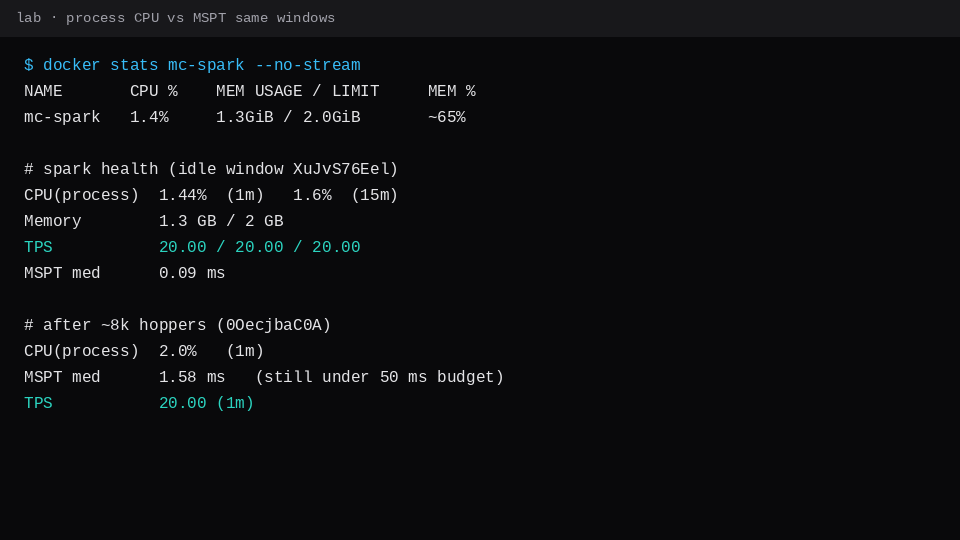
| Idle flat world | 20.00 / 20.00 / 20.00 | 0.02 / 0.09 / 0.67 / 21.9 ms | 1.44% | 1.3 GB / 2 GB |
| After ~8k hoppers | 20.00 / 19.92 / 19.97 | 0.005 / 1.58 / 14.5 / 452 ms | 2.0% | heap still under 2 GB |
The 452 ms max sits in windows that also cover a /reload and /fill. Read the median and the 95th for the steady story; treat a lone max as a spike until a profiler names it.
A compose sketch matching the lab:
services:
  mc:
    image: itzg/minecraft-server:java25
    container_name: mc-spark
    ports:
      - "25565:25565"
      - "25575:25575"
    environment:
      EULA: "TRUE"
      TYPE: PAPER
      VERSION: "26.3"
      MEMORY: "2G"
      ONLINE_MODE: "FALSE"
      ENABLE_RCON: "true"
      RCON_PASSWORD: "labspark"
      VIEW_DISTANCE: "10"
      SIMULATION_DISTANCE: "8"
      MODE: "creative"
      LEVEL_TYPE: "FLAT"
      OVERRIDE_SERVER_PROPERTIES: "true"
    volumes:
      - ./data:/data
Pin the Paper build you actually booted (26.3-242 here) when you publish numbers. Paper under systemd is the bare-metal twin of this Compose path.
How do you read a spark report?
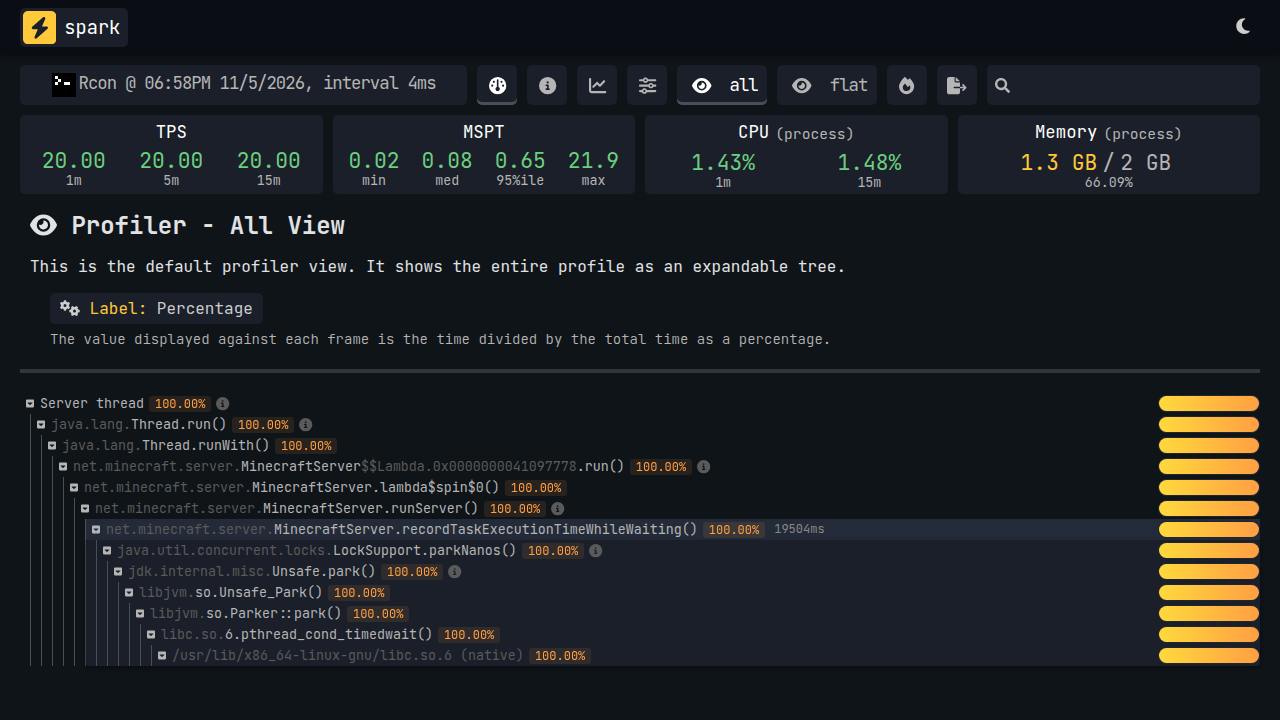
Open the uploaded link. Start on the Server thread row. Follow the largest percentage.
On an idle server the tree spends almost all of its time waiting for the next tick. Older guides name that frame waitForNextTick. On this Paper 26.3 build the idle profile (uv88d6kZeZ) sat under MinecraftServer.recordTaskExecutionTimeWhileWaiting → LockSupport.parkNanos at about 100% of the sample. The tick finished early; the thread parked until the 50 ms boundary.
When lag is real, that wait share shrinks. Work frames grow: tickServer, entities, hoppers, chunk generation, or a plugin under Sources. Expand the largest work frame and name what it shows.
After placing about 8,192 hoppers with /fill, health 0OecjbaC0A moved the MSPT median from 0.09 ms to 1.58 ms. TPS stayed at 20.00 on the 1m window. The profile (Z1W0dl1kno) still showed about 94.5% in the wait/park path and about 5% in processPacketsAndTick / tickServer. The server was busier. It was still inside the 50 ms budget on this CPU.
/spark tickmonitor --threshold-tick 50 reported average wall time near 50 ms on the quiet box (work plus wait). Spikes above the threshold print as individual ticks. For rare spikes, profile with a high threshold such as --only-ticks-over 100 so the upload is full of bad ticks instead of idle park time.
Ping vs TPS: which one are you fixing?
Client ping measures the network. MSPT measures the server thread. Both can make the game feel wrong. Only one of them answers to view-distance, entity caps, or a faster core.
| If you see… | Change… |
|---|---|
| TPS under 20, MSPT median near or above 50 ms | Workload or CPU (game server CPUs) |
| TPS 20, MSPT low, client ping high | Region / route of the host |
| TPS 20, MSPT low, process CPU high on the host graph | Steal or noisy neighbour on the host |
MSPT max spikes, GC lines in /spark gc | Heap and GC, then plugins that allocate |
The hopper window raised MSPT while process CPU stayed near 2%. A panel graph that only shows host CPU would have looked calm. Spark is what made the tick story visible.
Read the MSPT distribution. spark reports min, median, 95th percentile, and max. Two servers can both print 20.00 TPS while one sits at 15 ms median MSPT and the other at 45 ms. The second has almost no headroom for a farm, a chunk gen burst, or a plugin hitch. Averages also hide stalls: most ticks at 20 ms with occasional 300 ms freezes still feel like lag even when the long-run TPS badge stays green.
Paper's own profiling docs say the issue has to be happening while you capture. Profile an empty lobby and you mostly measure parkNanos. Profile while players fight in a dense build, load new terrain, or trip the redstone you care about. For rare freezes, /spark tickmonitor and --only-ticks-over 100 fill the report with the bad ticks instead of idle wait. Paper has bundled spark since 1.21; /timings is the old path.
What should you change after the report?
Config comes after the profile. Lowering every Paper flag before you have a frame to point at just moves the next spike somewhere quieter.
server.properties on this lab:
view-distance=10
simulation-distance=8
max-players=20
gamemode=creative
level-type=flat
online-mode=false
server-port=25565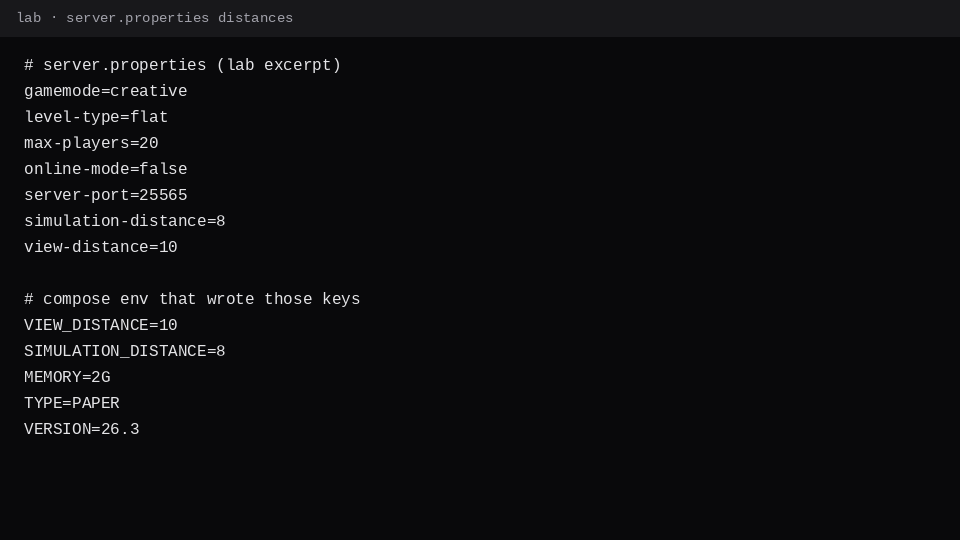
Useful order once spark names a cause:
- Cut
simulation-distance/view-distancewhen tick time sits in chunk and entity work around players. - Cap hoppers, entities, and redstone using a current Paper optimisation guide for your version (YouHaveTrouble's 26.3 guide is the one this backlog tracked).
- Pre-generate only when the profile shows chunk generation on the hot path (Chunky and friends).
- Raise heap when
/spark gcand the memory widgets say the collector is the spike. A host sales page that only quotes RAM is a weak reason on its own. The free Minecraft trial post is the OOM twin of this page.
Panels (Pterodactyl vs Pelican vs AMP vs Crafty) give you a console for these commands. A marketplace game server close to your players shortens the ping column when TPS is already 20. A 40 ms MSPT median still needs the profile and the CPU.
FAQ
Does more RAM fix Minecraft server lag?
When the report is a heap / GC story, yes. Idle on this guest used 1.3 GB of a 2 GB heap at 20 TPS. The hopper fixture moved MSPT without needing a larger heap. Size the heap from spark and GC, then shop RAM.
Can TPS be 20 while players still lag?
Yes. That is often ping or client performance. /spark tps at 20.0 with a 150 ms client ping is a routing problem.
How long should a spark profile run?
Long enough to cover the lag you care about. This lab used about 15 to 30 seconds on a known fixture. For random spikes, run longer or use --only-ticks-over so the tree is full of bad ticks. Spark's own docs lean toward multi-minute captures for production hunts.
Do I need to install spark on Paper?
Current Paper builds bundle it. Check the boot log for the spark profiler line before you drop a jar into plugins/.
What about Bedrock / Geyser?
This page measured Java Paper. Geyser adds its own thread story; profile that stack the same way, then keep ping and MSPT in separate columns.