
YABS v2026-10-31 finished in 2 min 49 sec. nr-liveval then took 7 min 13 sec. That is one KVM guest, Geekbench left off, and iperf3 cut to three sites. The 4k mixed total in the YABS table is 242.8k IOPS. The number nr-liveval prints for the whole guest is 1413, on a scale where 1000 matches the reference profile inside the script.
The YABS repo shows 6,795 stars and 573 forks. People paste the output on the LowEndTalk thread. The second script is the one NodeRings runs when a provider turns on hardware benchmarks during live validation. The preflight docs show the same file, and the same three-line download, and they say you can run it on any Linux guest to reproduce that step.
How to run YABS and nr-liveval
Save the file, then run it. The help text also shows curl -sL yabs.sh | bash, with flags after bash -s --. This guest used the copy from the master branch on GitHub. The banner printed v2026-10-31. Flags were -g to skip Geekbench, -n to skip the address lookup, -r to keep three iperf3 sites, and -j with -w to write JSON.
url=https://raw.githubusercontent.com
url=$url/masonr/yet-another-bench-script
url=$url/master/yabs.sh
curl -fsSL -o yabs.sh "$url"
bash yabs.sh -g -n -r -j \
  -w yabs.json
Geekbench 6 is on by default. -4, -5, and -7 switch the version and turn 6 off. -6 turns 6 back on, and the help text says it has to come last when you combine versions. -i skips iperf3. -f and -d skip fio. -b prefers the repo's fio and iperf3 binaries over a local package. A local fio or iperf3 is what the script uses when it finds one. This guest's fio was 3.36.
The free Geekbench 6 licence, on the Primate Labs EULA, is personal and non-commercial, for one named user and that person's own devices. This run passed -g. The CPU number in this piece is the sysbench mean from nr-liveval.
If Geekbench 5, 6, or 7 fails and the guest has 1 GiB of RAM or less, the script's own message says to add at least 1 GiB of swap, or to use Geekbench 4. The check sits in the failure path. TOTAL_RAM_RAW of 1,048,576 KiB is the line it compares. This guest has 47.8 GiB and 0 swap, and it skipped the test on purpose.
nr-liveval wants bash 4, sysbench, jq, and curl. fio, a compiler, ImageMagick, and pigz are optional. On a fresh VPS the root run installs what it can. This guest already had sysbench 1.0.20, jq, and fio, so the run set SKIP_INSTALL=1.
url=https://raw.githubusercontent.com
url=$url/noderings/noderings-benchmark
url=$url/main/nr-liveval.sh
curl -fsSL -o nr-liveval.sh "$url"
chmod +x nr-liveval.sh
sudo ./nr-liveval.sh
--self-test is the short smoke pass, about 30 seconds in the README. --sysbench-only keeps CPU and memory. RESULTS_DIR moves the output. Root writes /tmp/nr-liveval/results/results.json. A non-root user writes under ~/.cache/nr-liveval/results/. The default is five samples, one warmup, and 2,000 ms between samples.
How to read the YABS fio and iperf3 lines
The fio call inside the script is random mixed read/write, half and half, queue depth 64, two jobs, direct I/O, 30 seconds, and --gtod_reduce=1. Block sizes are 4k, 64k, 512k, and 1m. On x86 the file is 2G. On arm and RISC-V it is 512M. The printed table is bandwidth and IOPS. A latency column is absent, which is what that flag is doing in the command. If fio fails, the script falls back to dd. These numbers are the fio path.
| Block | Read | Write | Total |
|---|---|---|---|
| 4k | 496.67 MB/s, 121.2k | 497.98 MB/s, 121.5k | 994.66 MB/s, 242.8k |
| 64k | 4.07 GB/s, 62.2k | 4.10 GB/s, 62.5k | 8.18 GB/s, 124.8k |
| 512k | 6.24 GB/s, 11.9k | 6.57 GB/s, 12.5k | 12.82 GB/s, 24.4k |
| 1m | 5.23 GB/s, 4.9k | 5.58 GB/s, 5.3k | 10.81 GB/s, 10.3k |
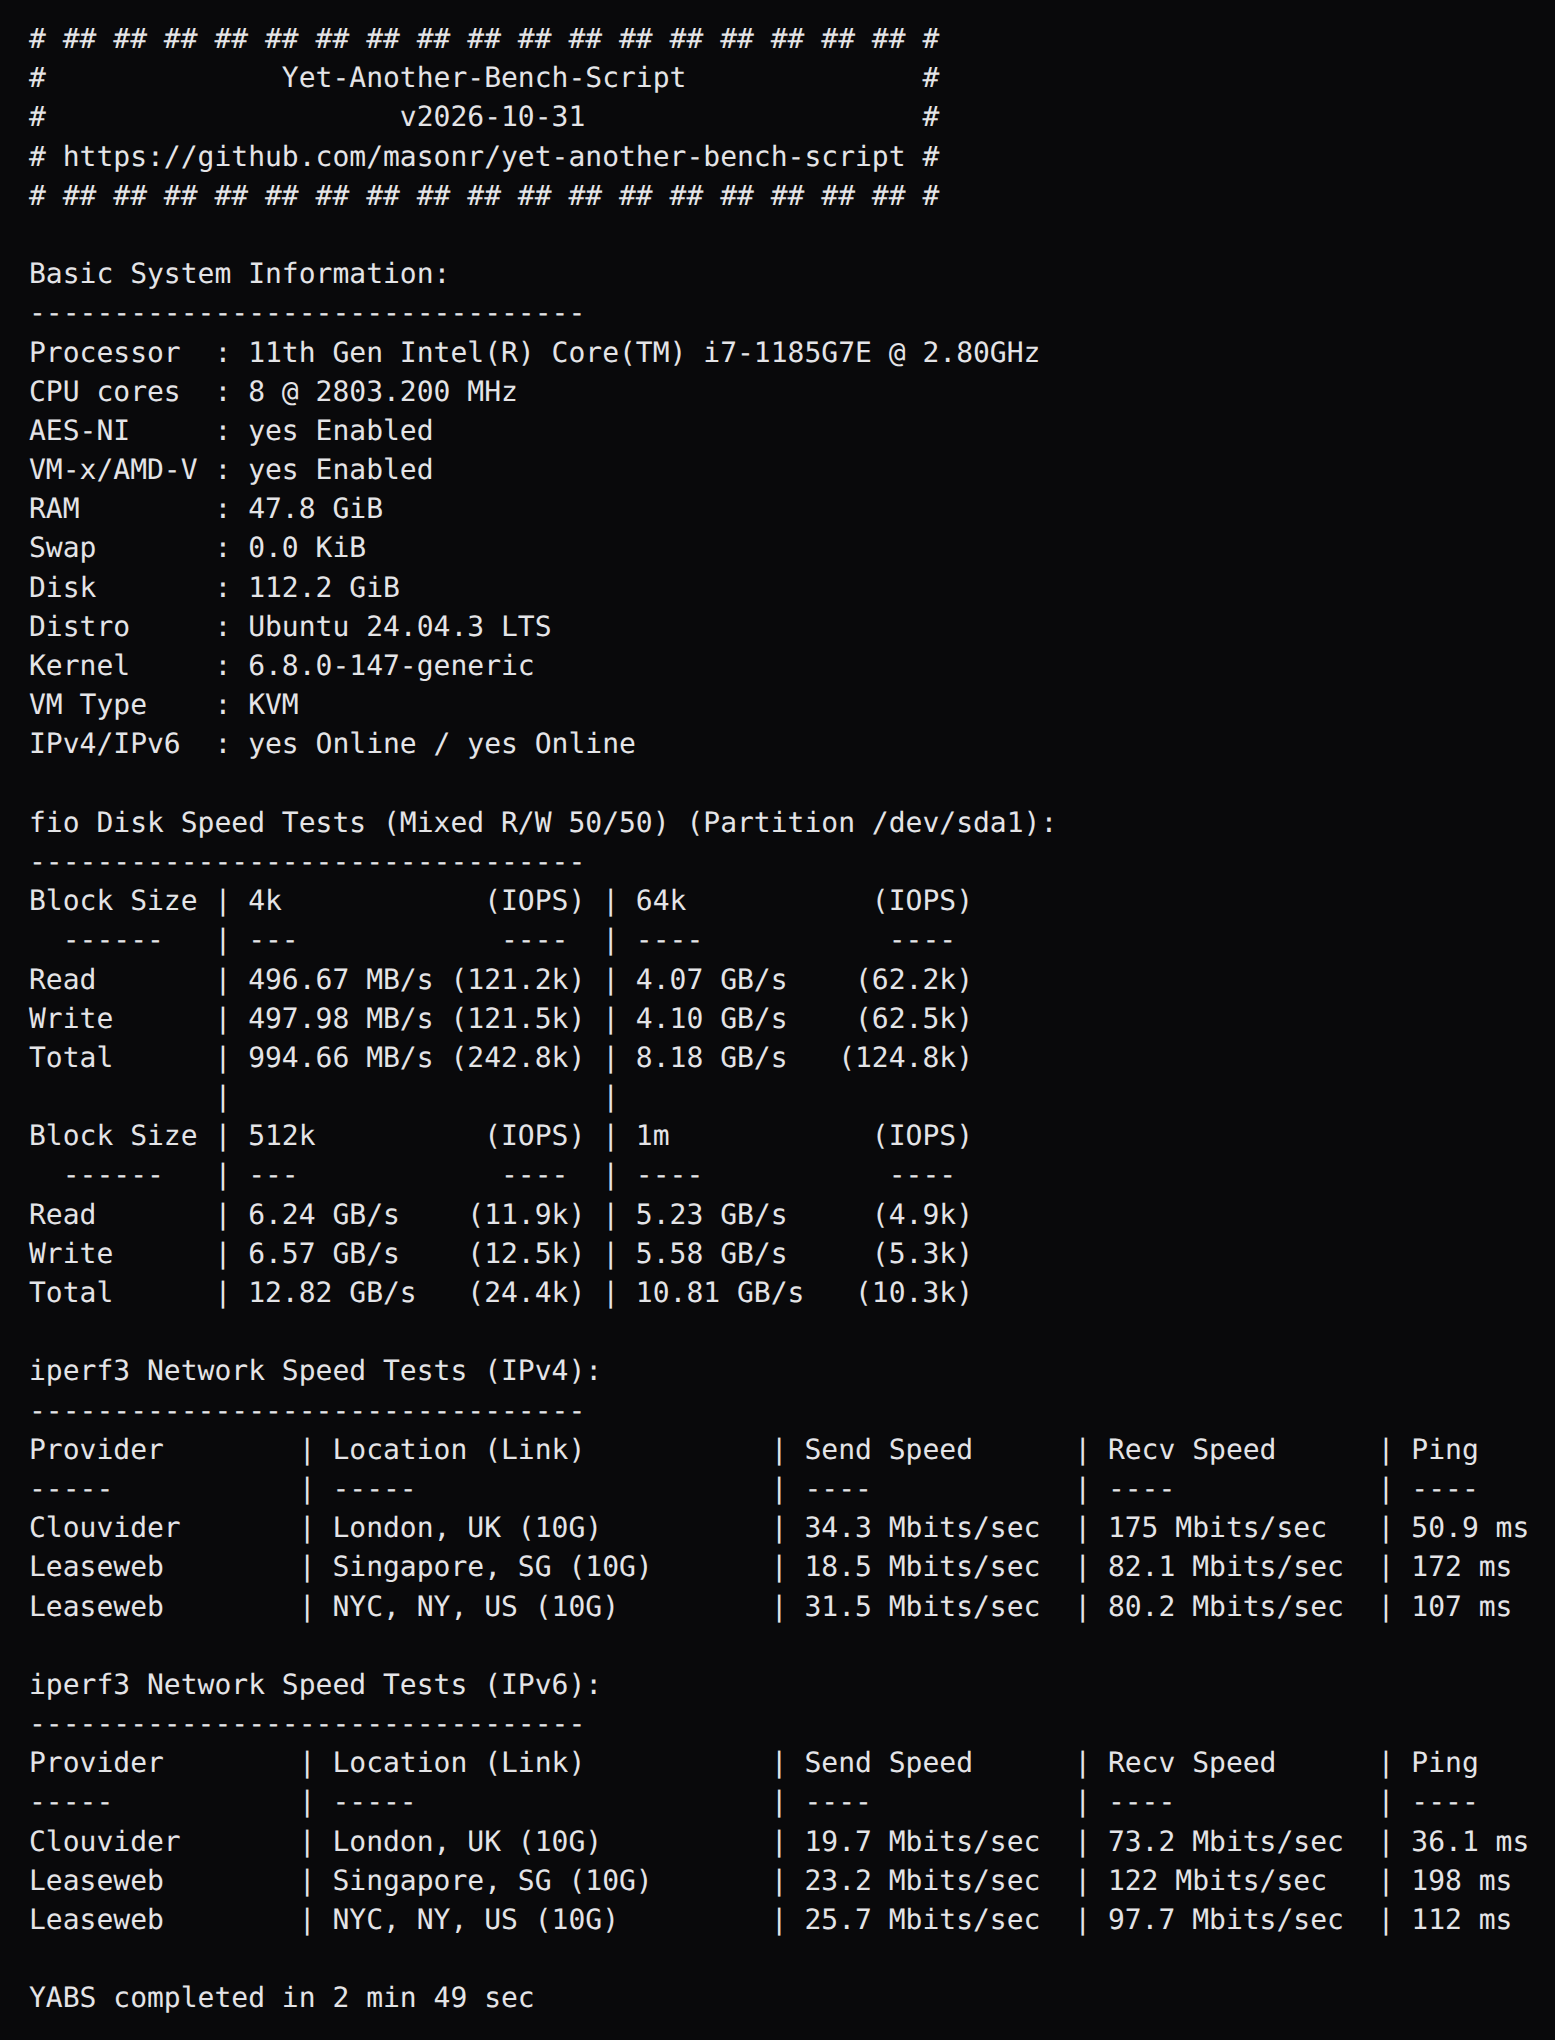
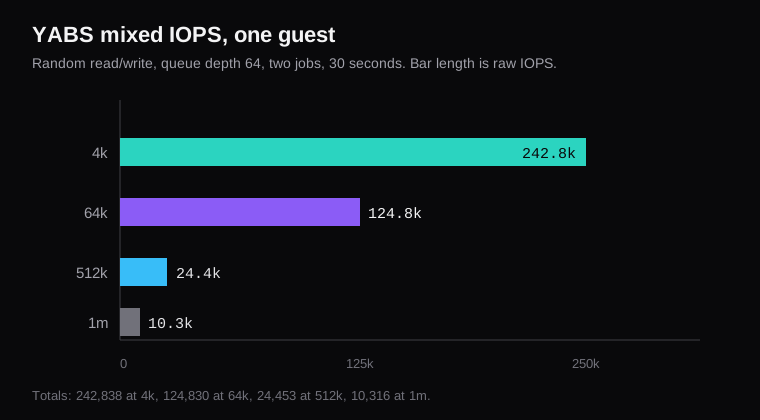
The 4k line is a lot of tiny operations in flight. Two jobs at queue depth 64 is 128 outstanding I/Os. A database doing one read at a time is a different queue. The 1m line moves more bytes per operation and posts fewer of them, 10.3k IOPS total against 242.8k at 4k, while the total bandwidth stays in the same neighbourhood, 10.81 GB/s against 994.66 MB/s at 4k. Read the block size before you compare two pastes.
-r in v2026-10-31 keeps three locations. The array is Clouvider in London, Leaseweb in Singapore, and Leaseweb in New York. A comment in the script names Online.net in France. The array that ran is London, Singapore, and New York. The full list, the one -r shortens, is longer: London, Amsterdam, Tashkent, Singapore, Los Angeles, New York, and Sao Paulo, with Helsinki commented out in the same file.
The (10G) in the location column is text the script attaches to that remote server. It is the far end's label. The speed column is what this guest moved.
| London | Singapore | New York | |
|---|---|---|---|
| IPv4 send | 34.3 Mbit/s | 18.5 Mbit/s | 31.5 Mbit/s |
| IPv4 receive | 175 Mbit/s | 82.1 Mbit/s | 80.2 Mbit/s |
| IPv4 ping | 50.9 ms | 172 ms | 107 ms |
| IPv6 send | 19.7 Mbit/s | 23.2 Mbit/s | 25.7 Mbit/s |
| IPv6 receive | 73.2 Mbit/s | 122 Mbit/s | 97.7 Mbit/s |
| IPv6 ping | 36.1 ms | 198 ms | 112 ms |
London received at 175 Mbit/s over IPv4 and the guest sent at 34.3. Singapore was the slow send, 18.5 Mbit/s, and the long ping, 172 ms. A 10G label next to an 18.5 Mbit/s cell is the remote port's advertisement sitting beside this guest's result.
vmstat 1 during that run put the steal column at a median of 0. Nine of 170 seconds were above 0. The mean was 0.13, and the highest second was 7. On this kernel a gu column follows st, so the header is the thing to read. The cumulative steal field in /proc/stat since boot was 0.16 percent of ticks.
How the Noderings score is built
1000 is the reference profile in the script, overridable with NR_REF_*. The defaults are 1,000 single-core events/s, 4,000 multi-core events/s, a scaling efficiency of 4.0, memory write 5,000 MiB/s and read 6,000, sequential disk read 2,500 MiB/s and write 1,500, HTTP download 100 Mbit/s and upload 50.
CPU is a weighted blend, 40 percent single-core, 45 percent multi-core, 15 percent scaling. Scaling is the multi mean divided by the single mean. Memory is the geometric mean of the write and read index scores. Storage is the geometric mean of sequential fio read and write, 1M blocks, direct I/O, queue depth 1, one job, a 64M file, 15 seconds, five times. Network is the harmonic mean of HTTP download and upload. The overall score is the geometric mean of the category scores that exist. A game server still lives on one thread, which is the reason the 40 percent single-core weight is the part worth staring at if the box is for Minecraft. That tick budget is in Ryzen 9000 vs EPYC vs Xeon for game servers.
| Category | Score | Mean that went in |
|---|---|---|
| CPU | 1208 | 1,373.95 events/s single, 4,708.74 on 8 threads, scaling 3.43 |
| Memory | 1274 | write 6,036.73 MiB/s, read 8,071.93 |
| Storage | 2703 | read 5,857.29 MiB/s, write 4,677.3 |
| Network | 959 | download 95.86 Mbit/s, upload empty |
| Overall | 1413 | geometric mean of those four |
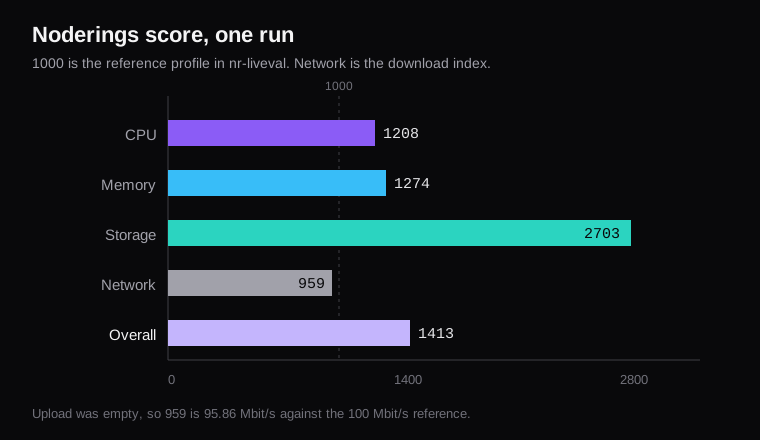
The arithmetic is checkable. Single-core 1,373.95 against 1,000 is an index of 1374. Multi-core 4,708.74 against 4,000 is 1177. Scaling 3.43 against 4.0 is 858. Weight those 40, 45, and 15 percent and the CPU category is 1208. Storage's 2343 and 3118, as a geometric mean, are 2703. Download 95.86 against 100 is 959.
Upload stayed empty. The script tried speedtest.tele2.net and then speedtest.ftp.otenet.gr, and both returned an empty upload. http_upload_mbps is null. The network category printed 959, which is the download index on its own, and that 959 is inside the overall 1413. Speedtest.net stays off unless RUN_SPEEDTEST=1. The ICMP average in the same file, 22.063 ms, is a probe. The methodology block says the latency probe stays out of the score.
The storage probe printed hdd for /dev/sda1. The script looks at the transport and at /sys/block/sda/queue/rotational. Transport was empty. Rotational was 1, and the rule maps that to hdd. The fio means above are what the score used. The label and the megabytes are answering different questions. One says how the virtual disk describes itself. The other says what sequential 1M direct I/O did for 15 seconds.
How to read a mean next to its samples
Five samples are the default. The script tags stability from the coefficient of variation. CV at or under 3 percent is stable. At or under 8 percent is moderate. Above 8 percent is unstable.
Single-core sat in a tight band, 1,370.42 to 1,377.12 events/s, mean 1,373.95, CV 0.19 percent, stable. Multi-core on 8 threads had a first sample of 5,290.01 and four more between 4,511.37 and 4,594.11. The mean is 4,708.74. CV is 6.94 percent, moderate, because that first sample is doing a lot of the lifting. Memory write is the loud one. The five samples were 7,021.22, 4,858.00, 7,020.08, 4,261.06, and 7,023.29 MiB/s. The mean is 6,036.73. CV is 22.61 percent, unstable. Read on the same test was stable, CV 2.32 percent, mean 8,071.93.
A paste that quotes 6,036.73 and stops has hidden a sample at 4,261 next to three samples near 7,020. The cv_percent field is the one that says those five samples disagreed. Disk read was unstable too, CV 11.33 percent, with a first sample of 7,030.66 MiB/s and the rest between 5,405.84 and 5,676.75. Download CV was 13.65 percent, samples from 76.48 to 112.22 Mbit/s.
The JSON also prints steal_percent_before and steal_percent_after as 3.03. On this guest that 3.03 matches the guest column of /proc/stat, 3.03 percent of ticks since boot. The steal column on the same line is 0.16 percent. The vmstat window above is the same story at one-second grain, a median of 0.
What to save from the run
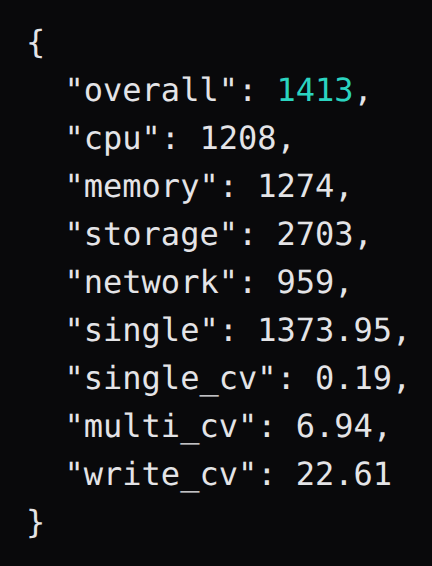
Keep results.json. The path on a root run is /tmp/nr-liveval/results/results.json, unless RESULTS_DIR moved it. This is the jq that pulls the headline and the CPU means.
jq '{overall:.noderings_score.overall,
 cpu:.noderings_score.categories
  .cpu.score,
 memory:.noderings_score.categories
  .memory.score,
 storage:.noderings_score.categories
  .storage.score,
 network:.noderings_score.categories
  .network.score,
 single:.sections.cpu.metrics
  .single_core.value,
 single_cv:.sections.cpu.metrics
  .single_core.statistics.cv_percent,
 multi_cv:.sections.cpu.metrics
  .multi_core.statistics.cv_percent,
 write_cv:.sections.memory.metrics
  .sequential_write.statistics
  .cv_percent}' results.json
Run it once when the box is new, and once on an evening when the host is busy, if the decision is a yearly invoice. The multi-core gap on this guest, 5,290.01 against a cluster near 4,550, is one run's worth of that question. The file you attach later is the JSON, with the samples still in it, because the mean will be the line everyone quotes and the cv_percent is the line that explains the mean.
Live validation, with hardware benchmarks turned on, is the same script on a short-lived pilot VM, then the pilot is removed. The score you produce on your own SSH session is the one you can read while the VM still exists. 1413 is this guest. A plan you are about to pay for gets its own file. The reference inside the script stays 1000 either way, and the 4k line from YABS stays a queue-depth-64 number, 242.8k IOPS on this disk, 2 min 49 sec after the banner.